
 ACCESS
Research Article
ACCESS
Research Article
Volume 1, Article ID: 2025.0001

Mohammed Abdulrahim
mohammedsadidee@gmail.com


Usman Habu Taura
usman.taura@unimaid.edu.ng


Abdulhalim Musa Abubakar
abdulhalim@mau.edu.ng


Marwea Al-Hedrewy
mereng@iunajaf.edu.iq

1 Department of Chemical Engineering, Faculty of Engineering, University of Maiduguri, P.M.B. 1069, Maiduguri 600211, Borno State, Nigeria
2 Oil and Gas Research Centre, Sultan Qaboos University, P.O. Box 34, Al-Khod, Muscat 123, Oman
3 Department of Chemical Engineering, Faculty of Engineering, Modibbo Adama University, P.M.B. 2076, Girei LGA 640001, Adamawa State, Nigeria
4 College of Technical Engineering, The Islamic University, Najaf 54001, Iraq
5 College of Technical Engineering, The Islamic University of Al Diwaniyah, Al Diwaniyah 59001, Iraq
* Author to whom correspondence should be addressed
Received: 30 Jan 2025 Accepted: 02 May 2025 Available Online: 03 May 2025 Published: 27 Jun 2025
Refinery-used metallic catalysts are supplied in oxide forms, meaning reduction is necessary for them to activate. Using glucose solution and a molar steam-to-carbon ratio of six (S/C = 6), NiO/Al2O3 catalysts are reduced at temperatures ranging from 500–750 °C. Steam reforming in a downflow bed reactor comes next. Through the use of XRD, TGA-FTIR, and SEM examination, the behavior of the reacted catalyst was examined. It was found that it is possible to reduce the catalyst at temperatures as low as 550 °C, but below 650 °C, the reacted catalysts become particle- and agglomerate-like. The agglomerated sample has much more carbon than the particle form, according to TGA-FTIR measurements. Agglomeration has a detrimental effect on the efficiency of steam reforming. SEM reveals that carbon is present in the agglomerated sample as big, flat plates of around 100
Biofuels were tested to reduce nickel oxide (NiO) to metal nickel (Ni°). TGA and TGA-FTIR showed weight loss and gas release during reduction. Ethanol gave the best reduction, starting at around 300 °C. XRD proved that NiO changed to metallic Ni. Biofuels can replace hydrogen as a cleaner reducing agent.
Refining processes play a crucial role in the upgrading and conversion of crude products. Operating refineries is a tremendously lucrative industry that brings in close to $2 billion annually [1]. Catalysts must be utilized to speed up the reaction to achieve high production yield and high-quality goods that will satisfy customers’ standard demands [2]. Approximately $2.3 billion, or 82% of the total amount of crude oil, was invested in refinery catalytic processes in 2015 [3]. There is a growing requirement for these refining catalysts, with a 5% annual growth in demand and a $2.8 billion cost in 2005, with further rises predicted [4]. The majority of these catalysts are metallic, meaning that they require chemical reduction before they can be used for the intended purposes. Typically, manufacturers supply these catalysts in an oxidized form to prevent potentially dangerous exothermic oxidization during storage or transportation [5]. The refinery is responsible for carrying out the initial stage of the activation process, which involves using hydrogen (H2), ammonia, or a highly diluted methane (CH4) steam feed [6]. The main constituents are hydrocarbons (which have a ratio of 0.5 H2 to 2 carbons), various compounds of oxygen, nitrogen (N2), and sulphur—as well as organometallic particles such as vanadium (V), iron (Fe), nickel (Ni), titanium (Ti), and sulphur (S) having molecular weights around 2000 [7]. Its boiling point varies greatly from ambient temperature to roughly 650 °C for H2 [7]. The catalytic process enabled the development of an upgrading technique to refine products of crude oil from fuel oil, diesel, petrol, lubrication, and jet fuel [7]. According to the National Research Council (1992), nearly 60% of products from petrochemical plants and 90% of petrochemical processes are catalytic [8]. This is because of the wide range of molecular weight and structure that greatly varies their usage as fuel oil, chemical feed stock, and lubrication products [7], The following processes call for a reduced metallic catalyst: isomerization [9], hydrotreating, hydrocracking, catalytic reforming [10], steam reforming, and Fisher tropsch processes [11]. The research gap addressed in this study lies in the limited exploration of biofuels as reducing agents for activating metal catalysts, especially in comparison to traditional methods using H2 gas. Even though H2 is effective, it is costly, energy-intensive, and involves safety concerns. There is a need to find greener, safer, and more sustainable alternatives. This study investigates how common biofuels (viz., methanol, ethanol, and glycerol) can reduce NiO to its metallic form, which is essential for catalytic activity in refinery processes. In particular, the objective of the study is to characterize the reducing properties of biofuels; specifically, glucose solutions with a steam-to-carbon (S/C) ratio of 6, for the activation of Ni-based catalysts (NiO/Al2O3) used in refinery processes. By examining the reduction process across various temperatures (500–750 °C) and analyzing the resultant catalyst behavior using techniques such as X-ray diffraction (XRD), thermogravimetric analysis coupled with Fourier transform infrared spectroscopy (TGA-FTIR), and scanning electron microscopy (SEM), this work aims to optimize conditions for the catalyst’s activation and evaluate its performance during steam reforming. The study further seeks to understand the effects of temperature on catalyst morphology, agglomeration, carbon deposition, and H2 production, to improve the efficiency and sustainability of refinery catalytic processes.
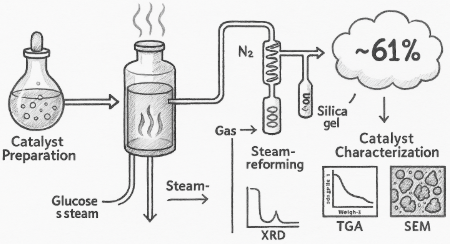
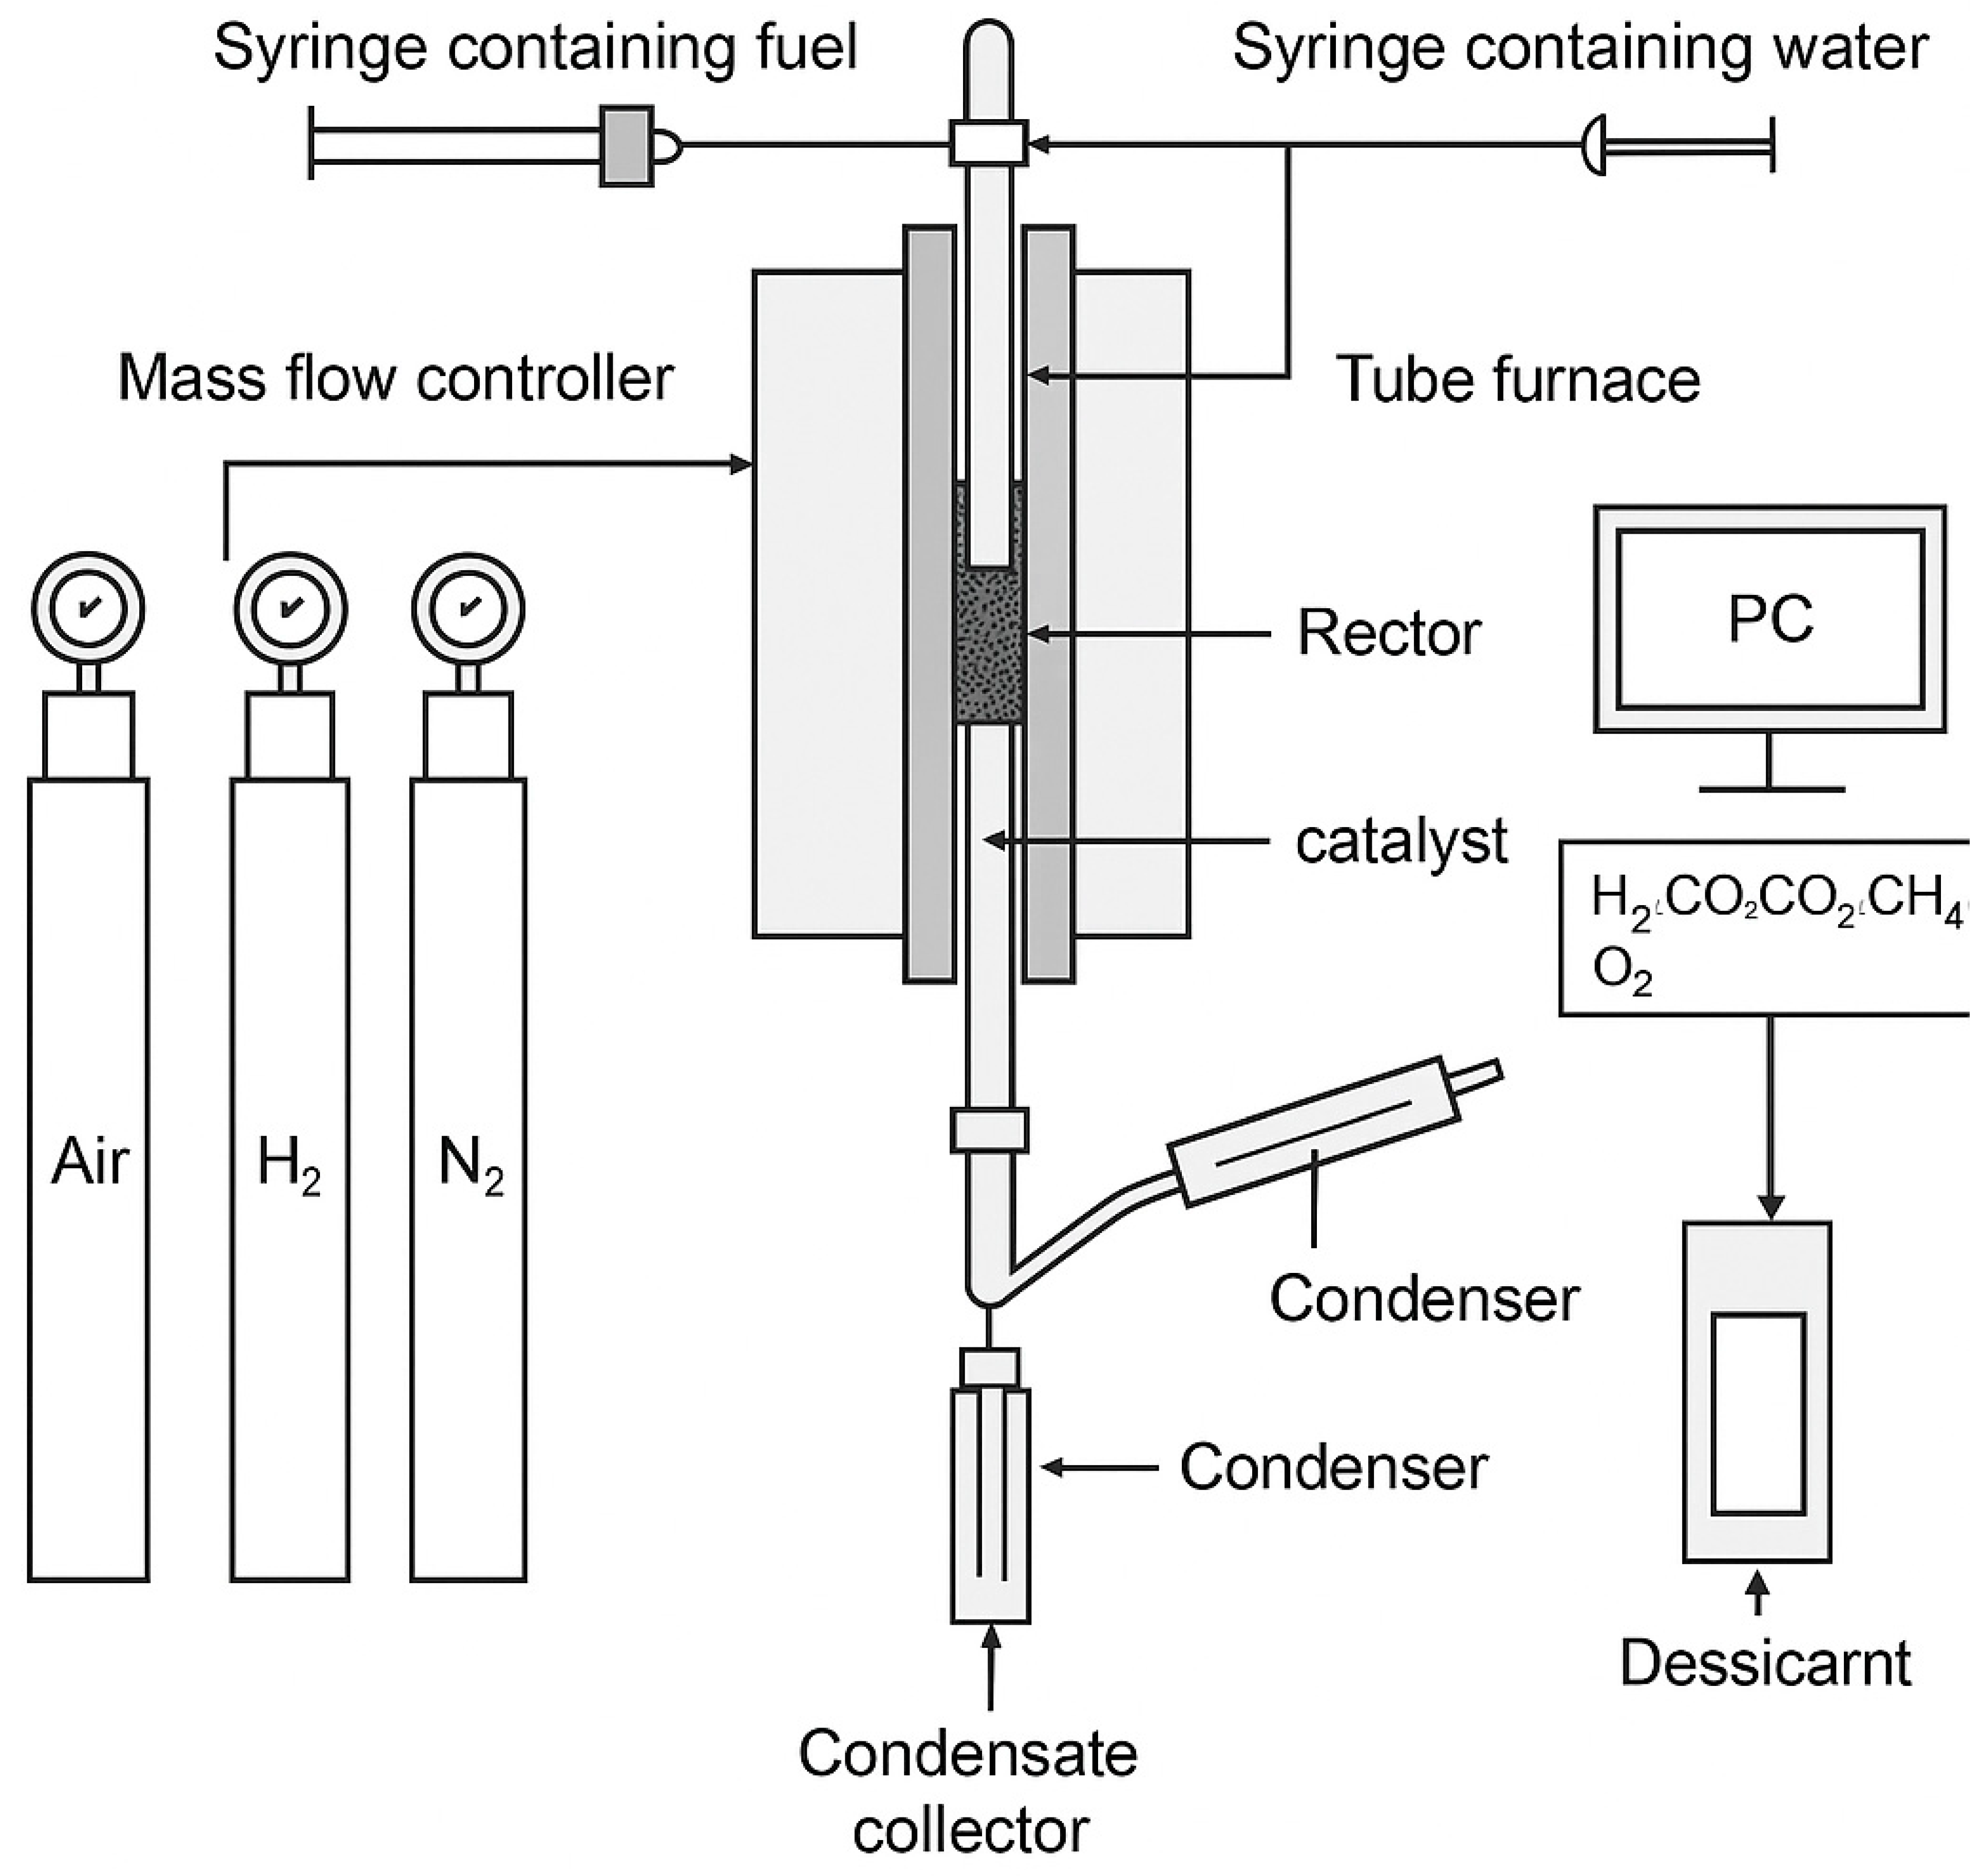
2.1. Sample Preparation The catalyst utilized in this study is Johnson Matthey’s 18 wt. NiO/α-Al2O3 catalyst. It is worth noting that NiO/α-Al2O3 refers to a composite or supported catalyst material where nickel (II) oxide (NiO) is dispersed on or supported by alpha-phase aluminum oxide (α-Al2O3), also known as alpha-alumina. The catalyst was delivered in pellet form. Before its use, it was crushed and sieved to a particle size of 0.85-2 mm. To create a glucose solution, distilled water was mixed with pure glucose. Following an overnight incubation period at room temperature without stirring, 2 g of catalyst particles were added to a 20 mL glucose aqueous solution (10 g/L). Subsequently, the sample underwent a drying cycle in an oven at 80 °C for 12 hours. Figure 1 illustrates the uniform grey-green hue of the new catalyst particles. In this work, precise results were presented. Some measurements of high accuracy demand were carried out in duplicate. It is believed that such will reduce uncertainty and enhance the reliability of the study outcomes. 2.2. Reactor Set-Up for Carrying Out Reduction Reaction Firstly, the reduction experiments were carried out inside a down-flow bed reactor as described in Figure 2. An aqueous solution of glucose with a specific S/C ratio was introduced at a given flow rate. It was done by using a spring to pump it into a reactor, as the flow rate of the gases (i.e., H2 or N2) is regulated using an MKS mass flow rate controller, where the gases are cooled down using a double condenser at a temperature of −7 °C. Absorption happens if the energy of infrared light that is transmitted into molecules initiates some rotational or vibrational states. Silica gel was used to remove moisture from condensable constituents that are trapped inside the condensate collector. Furthermore, every 5 s, a composition of dry outlet gas was reduced by using the Advanced Optima Analyzer (ABB), which is capable of identifying carbon monoxide (CO), H2, carbon dioxide (CO2), and CH4. The concentration of CH4, CO, and CO2 was measured using infrared absorption (Uras-14), while the H2 concentration was measured by thermal conductivity detector (Aldos 15). 2.3. The Experimental Procedure This experiment used a continuous flow of N2 (carrier gas) at 200 sccm (absolute pressure) at various temperatures (500, 550, 600, 650, and 700 °C) in the absence of air. For all runs, a 4.5 mL/min flow rate of glucose solution with an S/C ratio of 6 was added to the reactor and left for about 80 min. The processes in Reactions 1–4 (or R1–R4) illustrate the following: water gas shift reaction, steam reforming overall, glucose steam reforming based on a method proposed by Masuda et al. [12], and NiO reduction reaction by glucose solution [13]. Reactions 1–4 simply revealed the mechanism of the product species, i.e., reduced Ni, H2, CO2, and CO. Various mechanisms have occurred, and they include adsorption of reactant, recombination reaction, desorption of product from the catalyst, and the formation of intermediates on the surface of the catalyst. 2.4. The Concept of Process Outputs and Elemental Balance Elemental balances were used herein to calculate the conversion of glucose and water, the production of H2, and the rate at which NiO is reduced. For fuel with a general formula of CnHmOk, equations and related assumptions for these computations were provided in Martín [14]. Based on N2 balance (Equation (1)), the molar flow rate of total dry output gas (
) was calculated. As stated in Equation (2), the calculation of glucose conversion (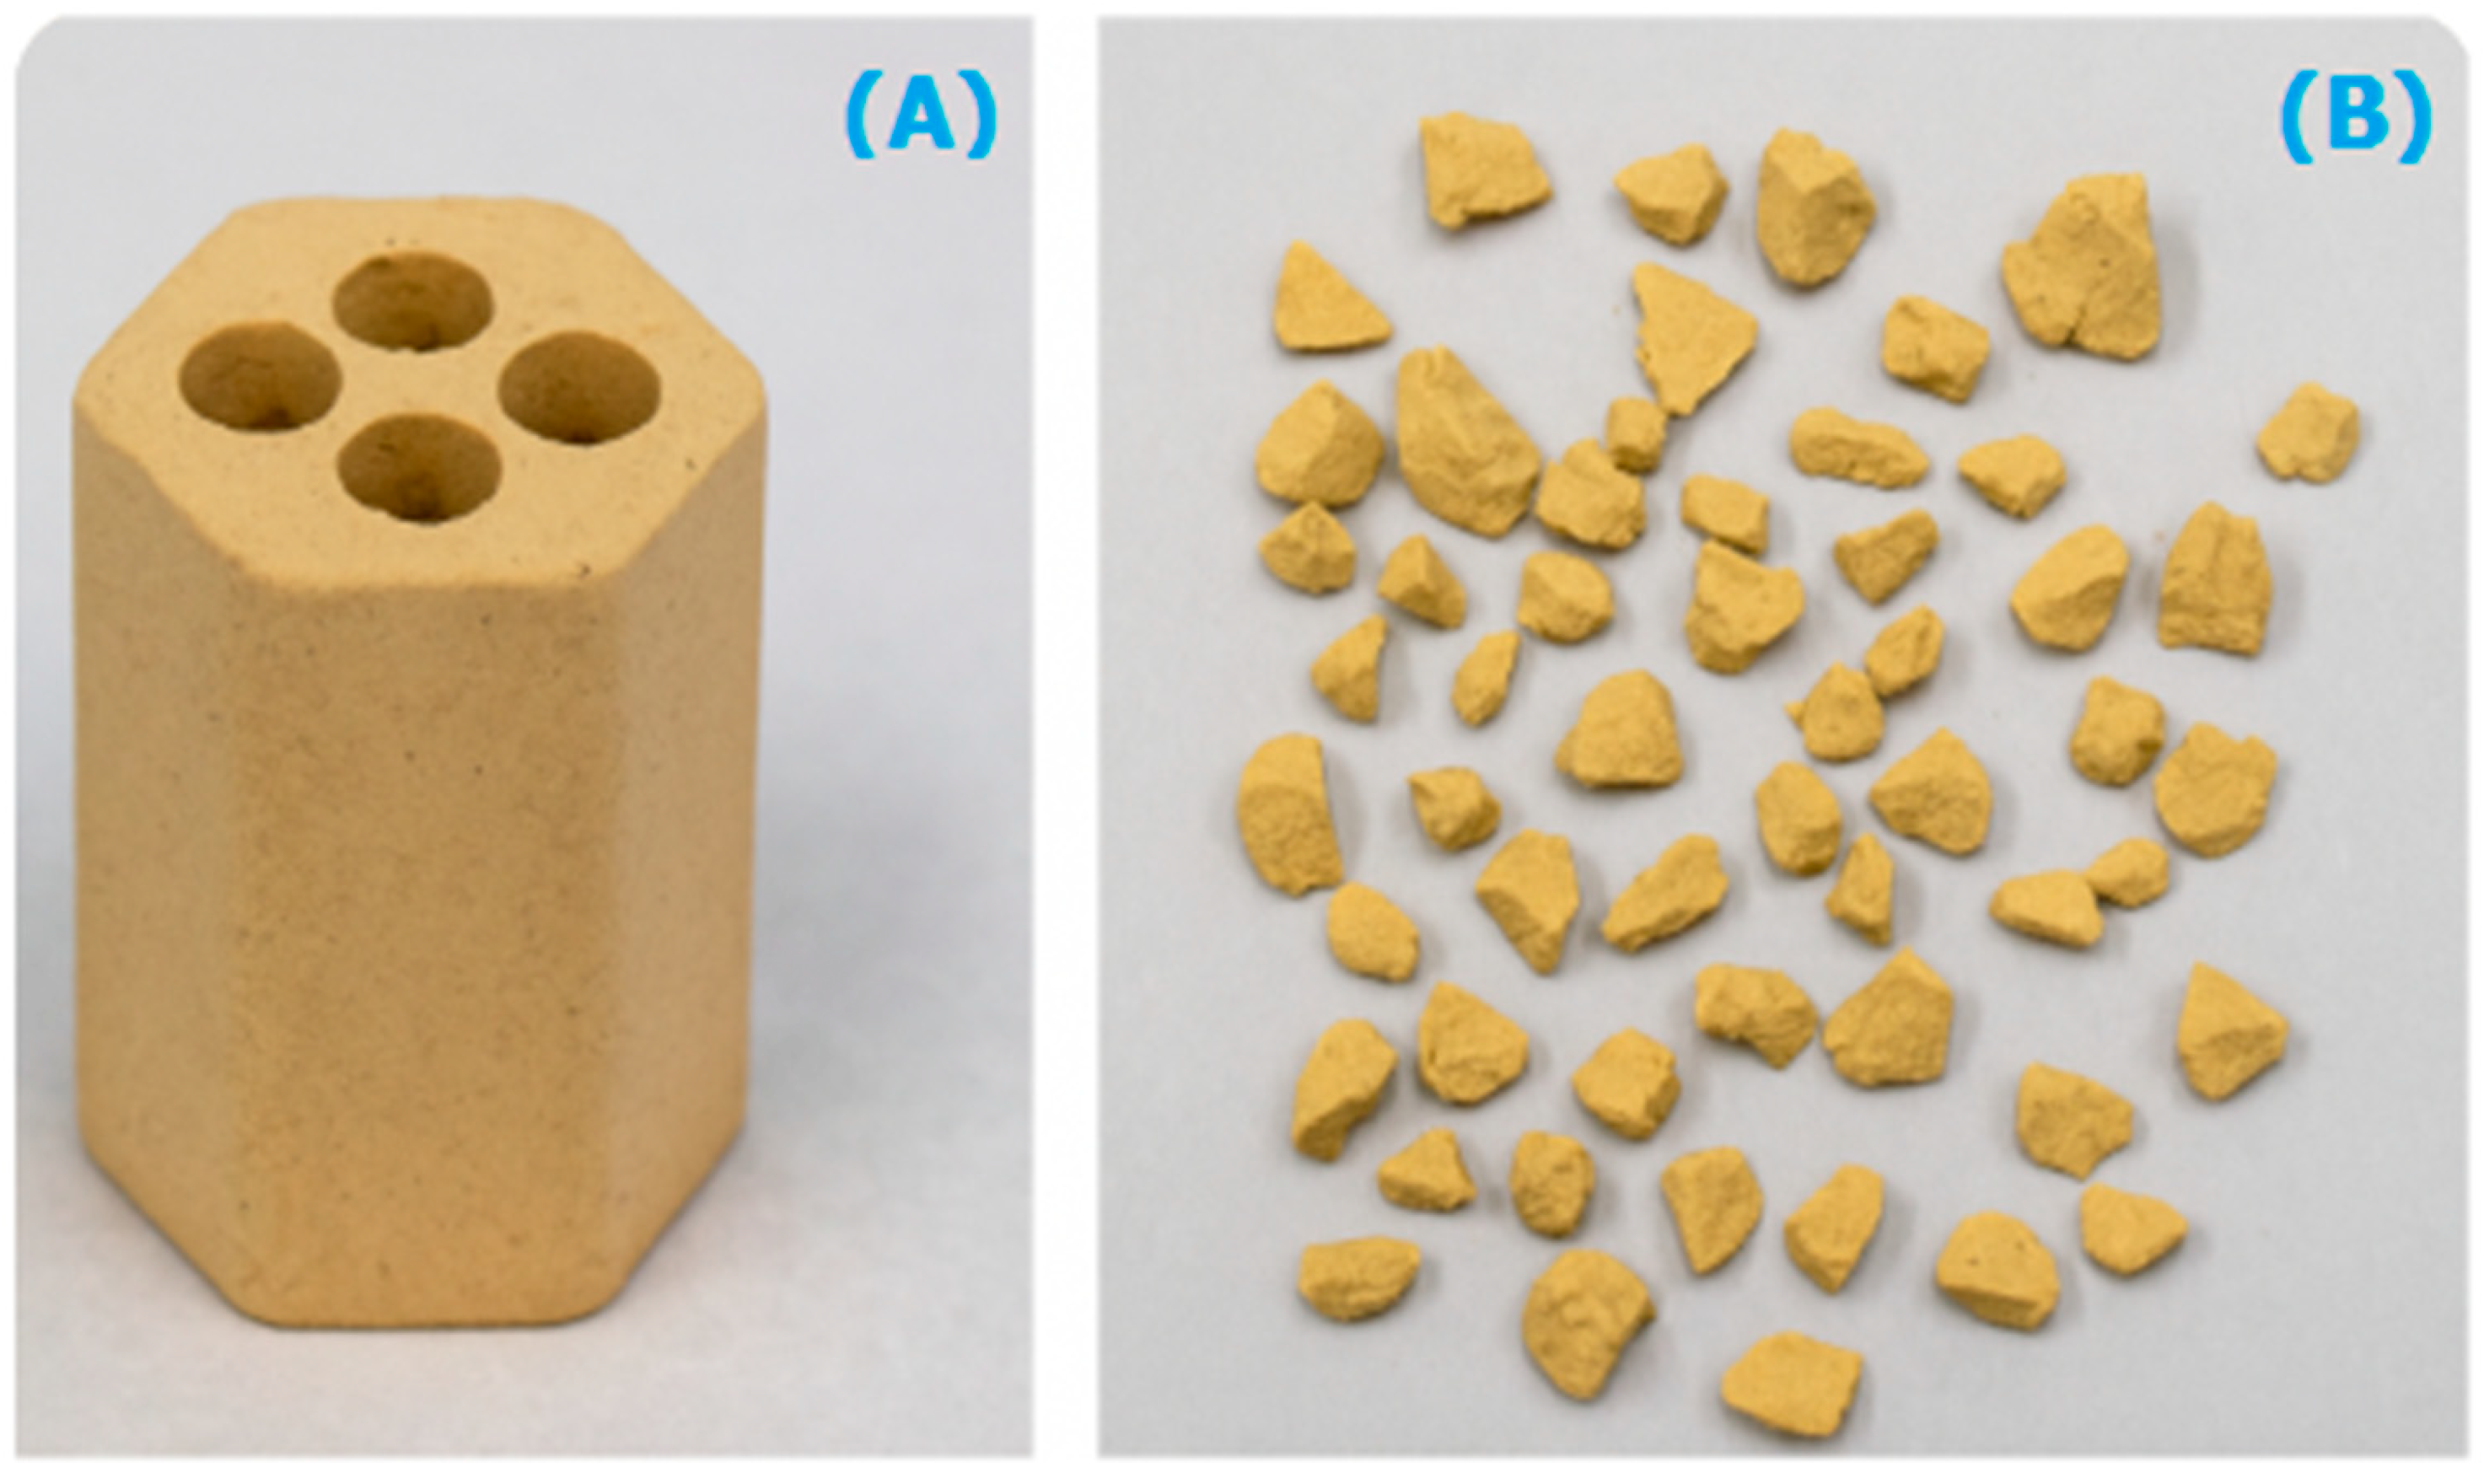
H2O conversion ( ) was calculated based on an H2 balance of Equation (3). Note that H2 yield is defined as the percentage of H2 produced experimentally with respect to the theoretical maximum, according to Equation (4). Moreover, for the evaluation of the reduction rate of NiO to Ni, Equation (5) was used. Equation (6) is the conversion of Ni in the process.
2.5. Characterization
2.5.1. Thermogravimetric Analysis
TGA was carried out with TGH1000 using Stanton Redcroft. The experiment was carried out at a heating rate of 5 °C/min, ranging from normal room temperature to 900 °C under pure air flow or N2. About 200 mg of sample was used in every test. The background data collected is consistent with the gas flow for approximately 25 min. It was then used to correct the FTIR test background. However, integral absorbance of a specified spectral region is shown on the chemigram profile as a function. The main reason for using the chemigram profile shown in Table 1 was to identify regions that contain peaks of one component.
Parameter for Collecting Chemigram Profile.
| Component | Baseline (cm−1) | Region (cm−1) |
|---|---|---|
| CO | 2000–2250 | 2000–2250 |
| CO2 | 2250–2400 | 2250–2400 |
| Formic acid | 900–1200 | 900–1200 |
| Water | 1300–2000 | 1300–2000 |
TGA-FTIR is a temperature-programmed instrument used to analyze the coke combustion performance on the surface of the reacted catalyst. It is a technique that uses an interface to combine FTIR and TGA [15]. Using an air-heated TGA instrument, the mass change of the sample during a specific period was monitored at a rate of 10 /min. A TGA’s FTIR instrument was used to track the changes in gases over time. As a result, the FTIR gadget releases a 3D spectrum: wave number, time, and IR absorbance. The chemigram profile illustrates how gas emission varies with temperature. Consequently, it gives a chemigram profile that indicates the relative amounts of H2O, CO, and CO2 [16].
2.5.2. XRD and SEM-EDX Analysis
XRD determines the product’s crystalline percentage and degree of reduction. To perform an XRD test, the catalyst particles were essentially ground into fine powder. An X’pert PAN analytical High Score Plus software was utilized for the Rietveld refinement phase analysis [17]. The Rietveld Refinement is a full-pattern fit approach used to analyze the sample’s composition. Because many metrics, including the strain effect, size effect, temperature factor, and lattice parameter, are used to compare the estimated and observed profiles [18]. Nevertheless, the result indicates the phase level (in weight percentage) present in each sample. Furthermore, the percentage of NiO conversion to Ni was determined in this research using Rietveld refinement [19]. It provides information on the decreased catalyst’s surface morphology. SEM (SEM, LEO 1530, Oberkochen, Germany), described in Narang et al. [20], was used to evaluate catalyst morphological changes, both before and after the reduction process, as well as the development of carbon on the catalyst’s surface. The sample’s surface was subjected to semi-quantity analysis using an EDX machine manufactured by Oxford Instruments plc, Abingdon, UK, which gives the X-ray emissions that occur when the sample is exposed to an electron beam [21].
2.5.3. CHN Elemental Assessment
A CHN elemental analyzer (Flash EA2000 by CE Instruments Ltd. with Registered office address: The Old Barn Swan Lane, Hindley Green, Wigan, Lancashire, WN2 4HF in the United States) was used to determine the carbon and H2 content of these samples. Tin capsules were filled with approximately 15 mg of powder samples. Before the tin capsule was entered into the analyzer, it was carefully folded to release any contained air. A high degree of reproducibility was obtained, and duplicate determination was done.
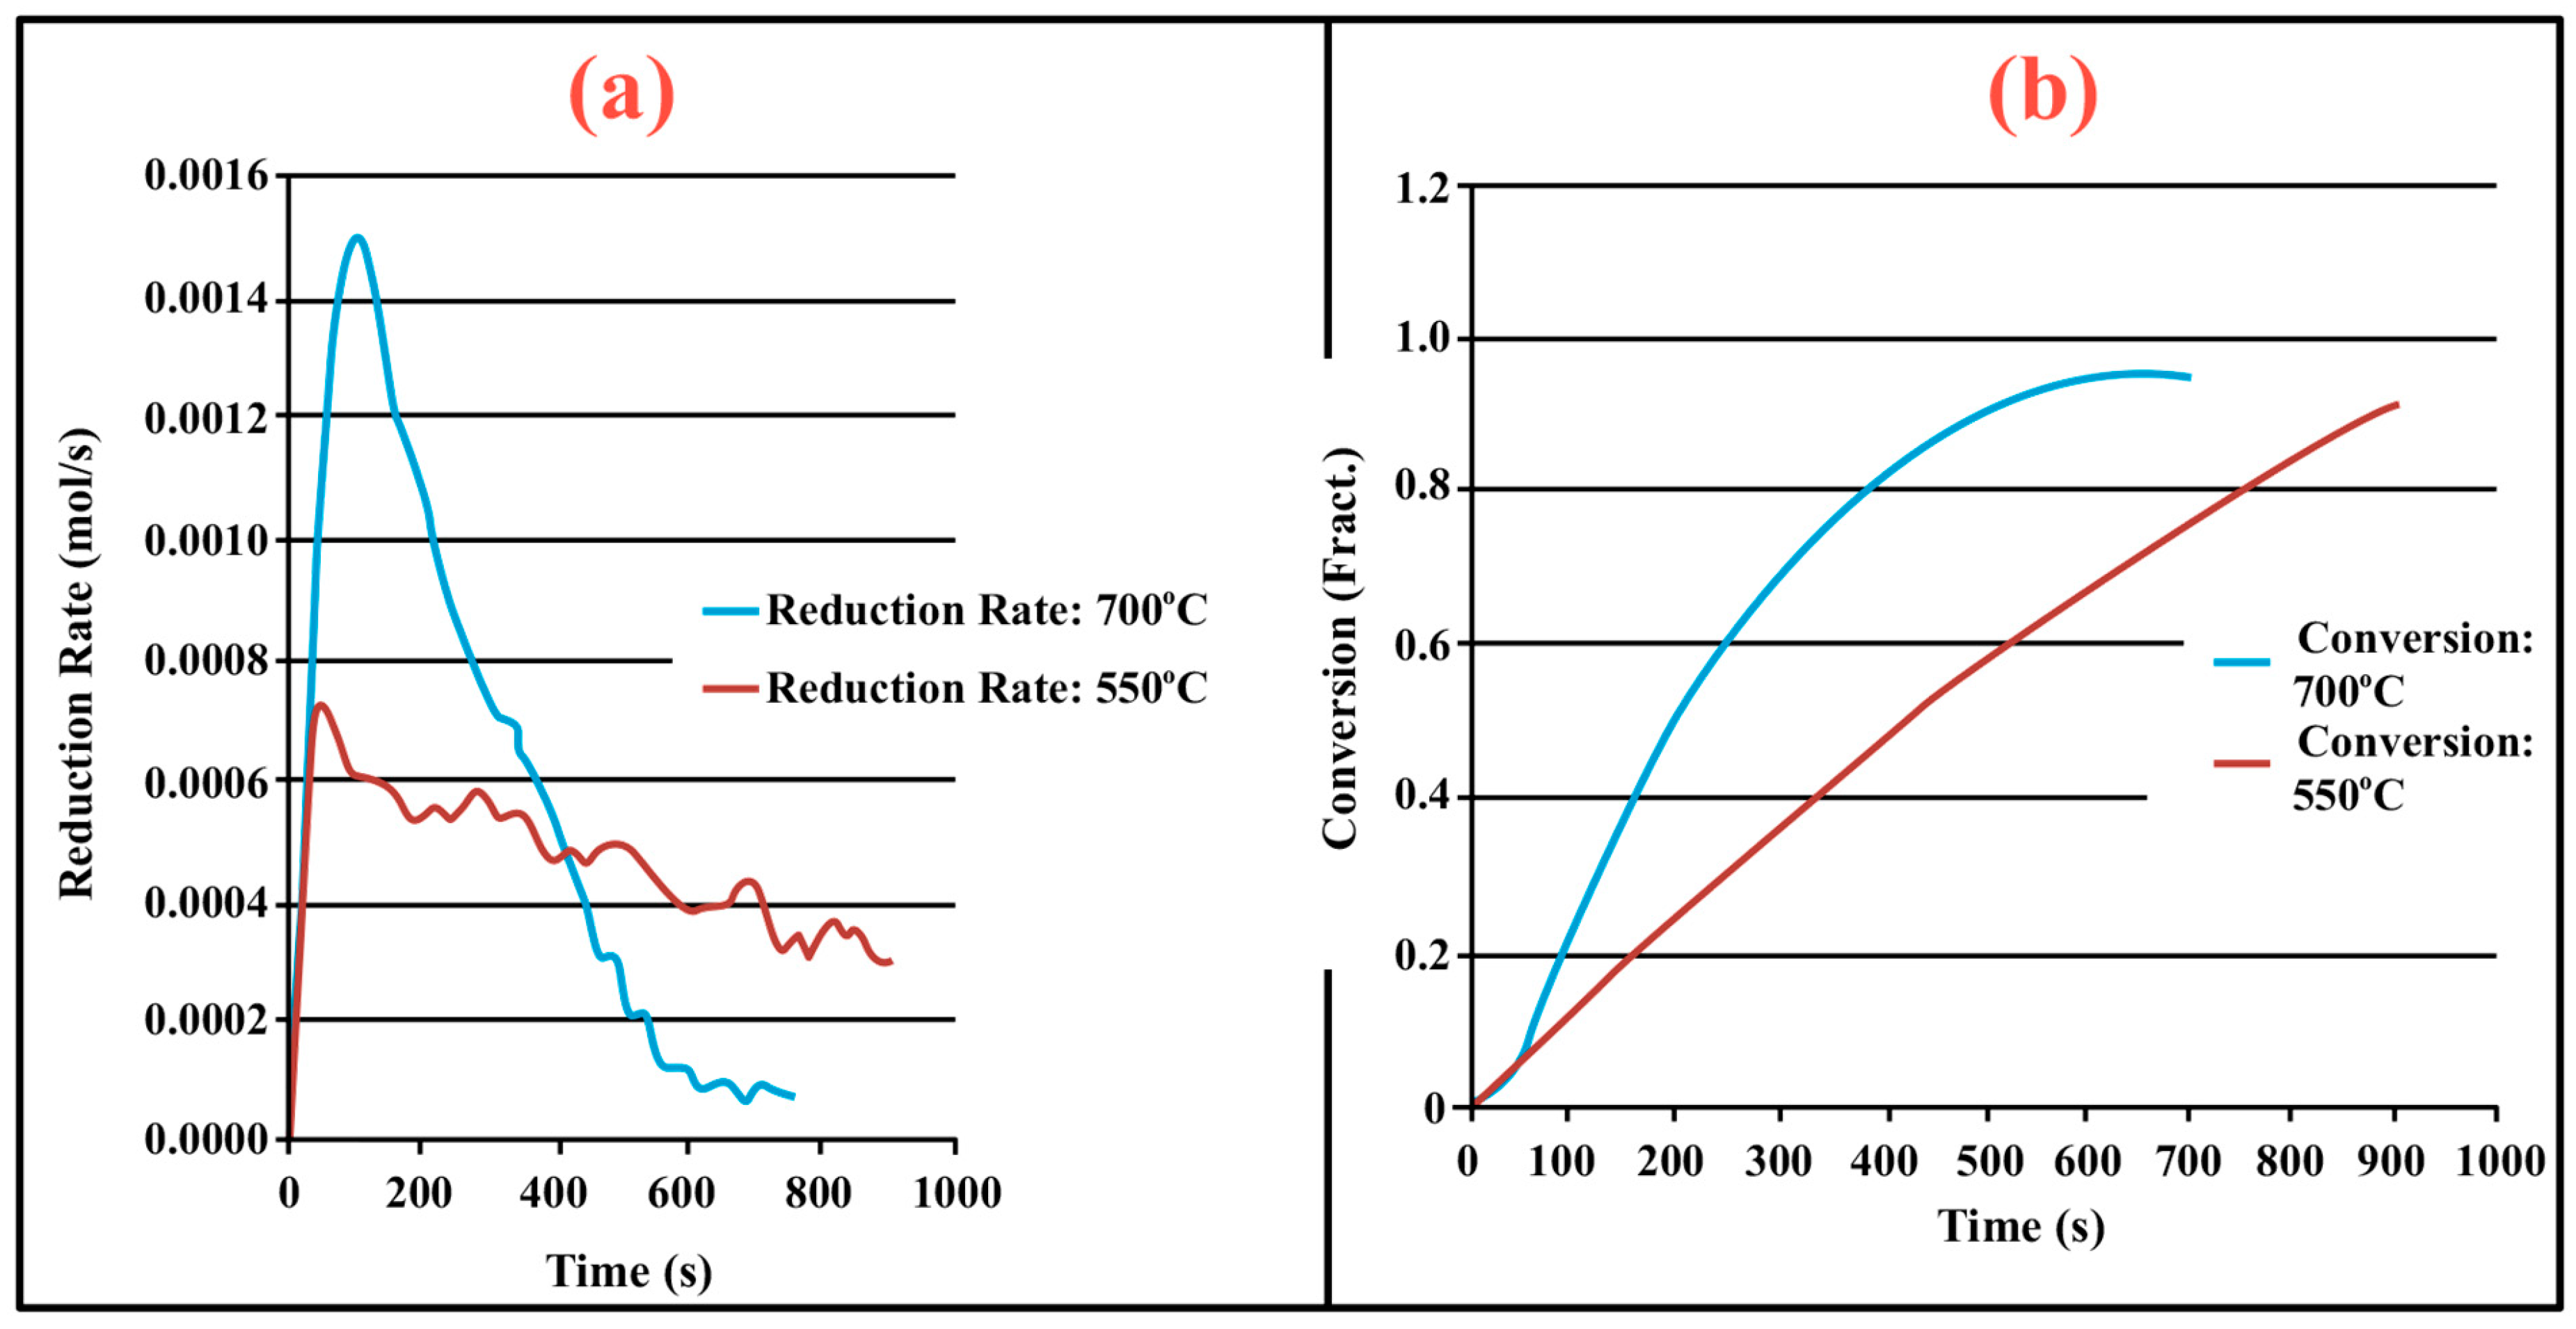
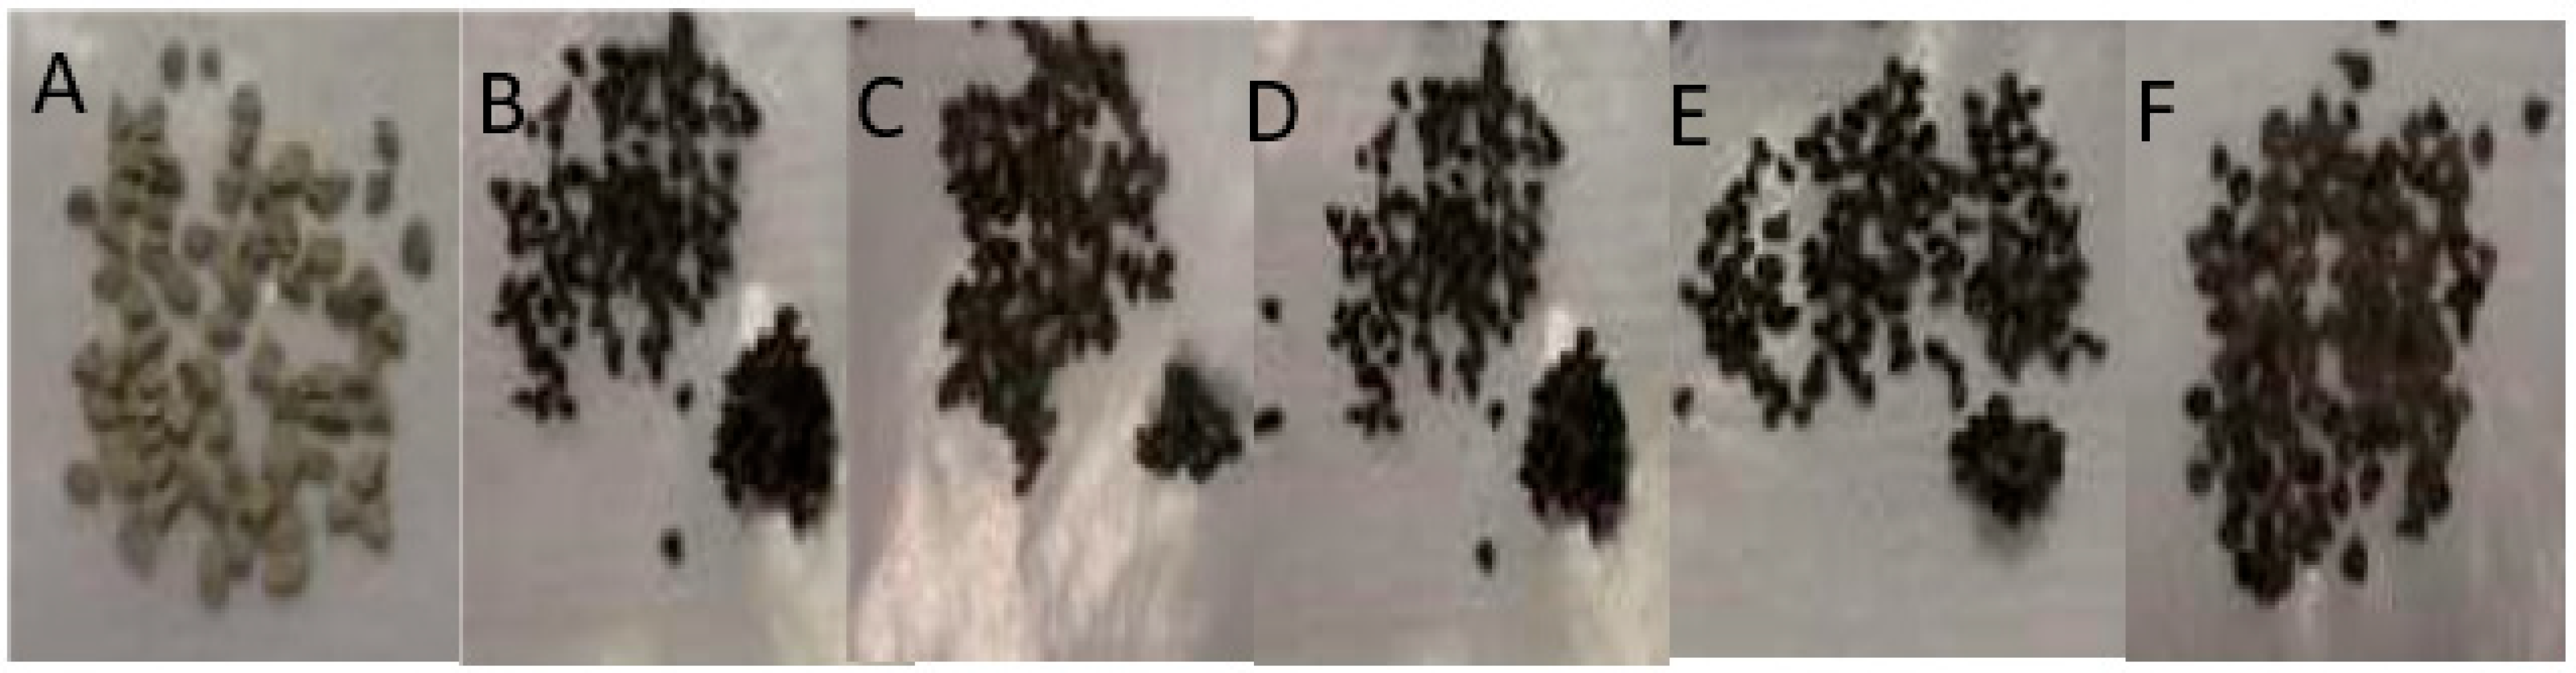
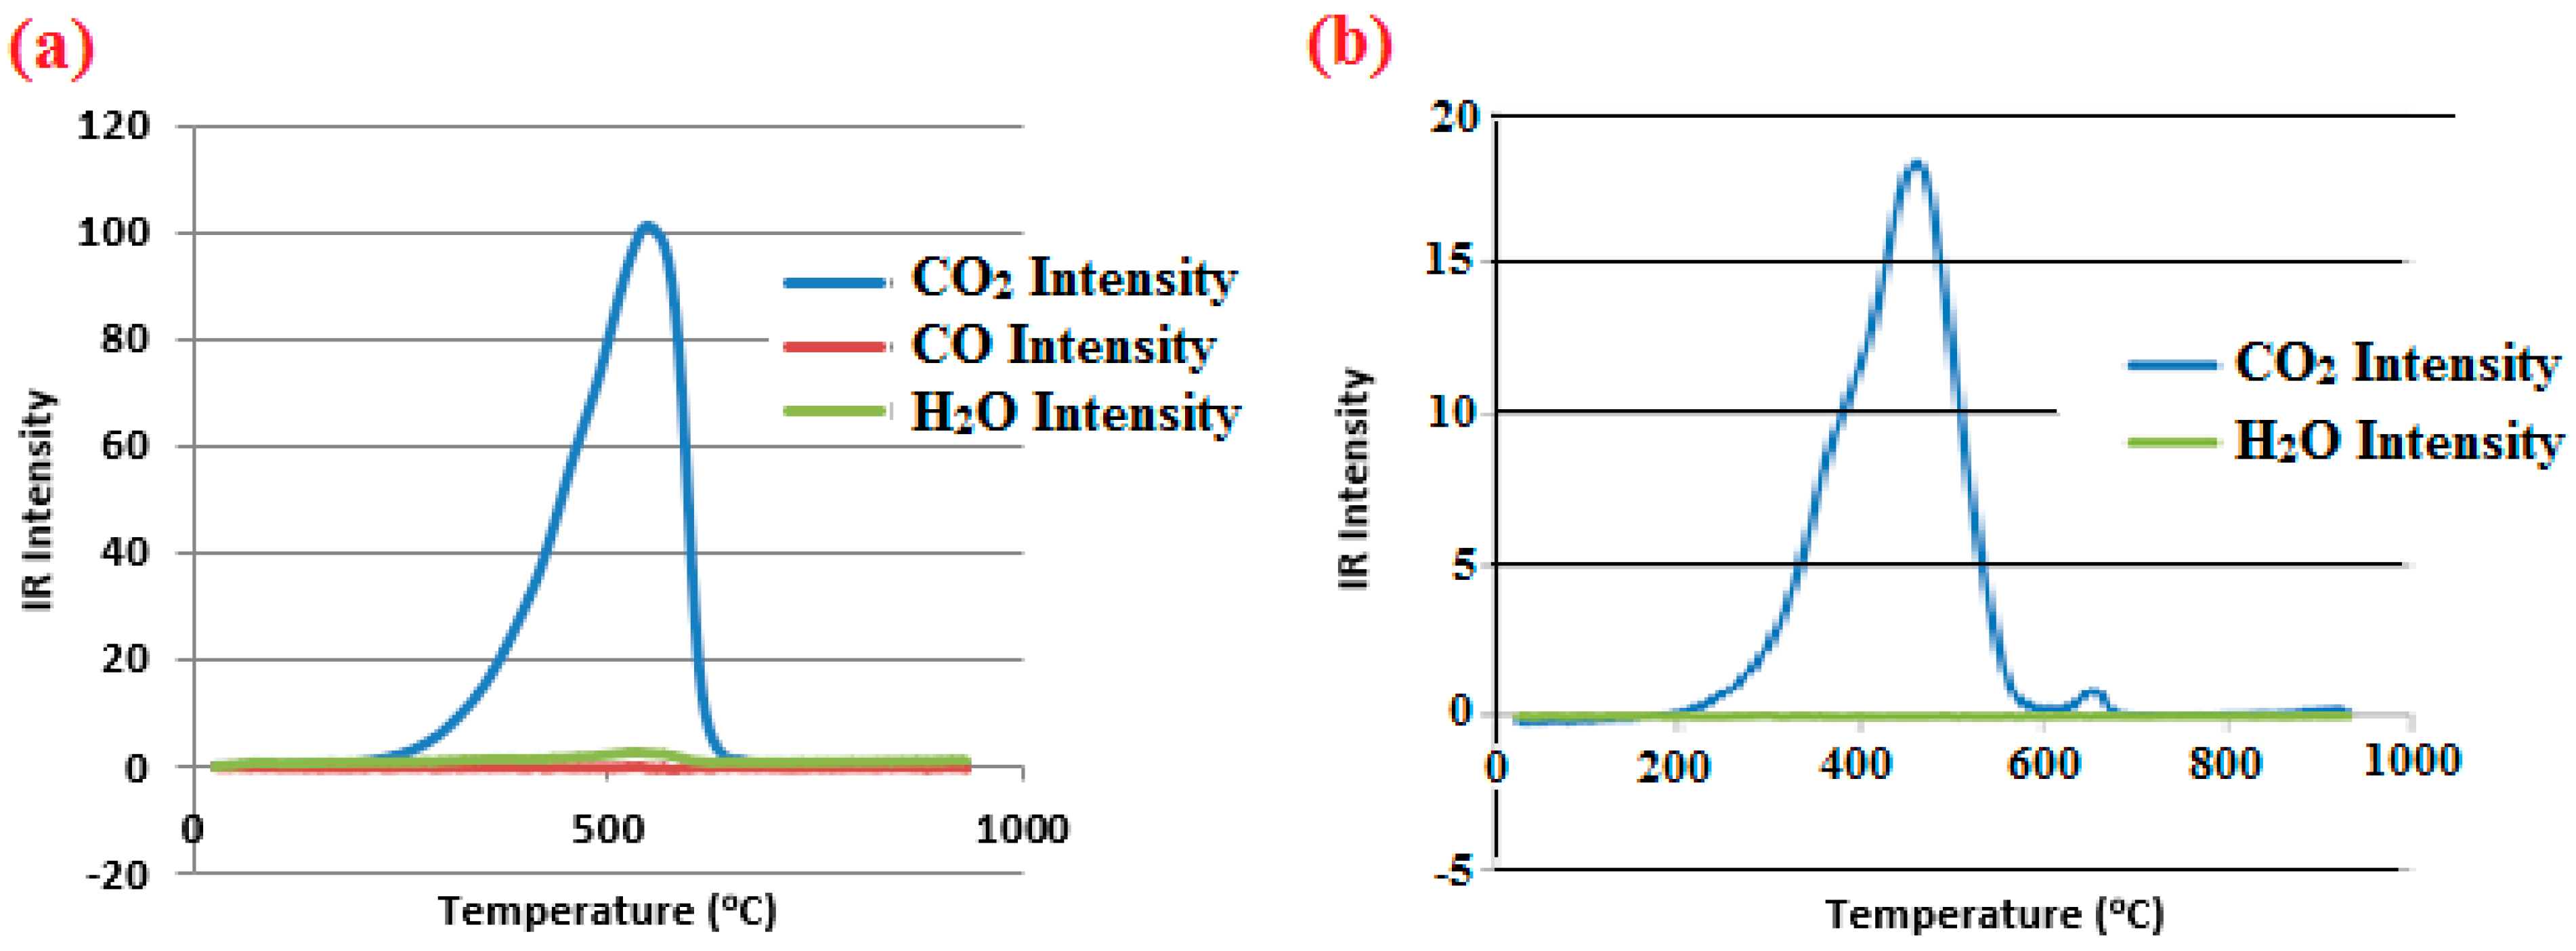
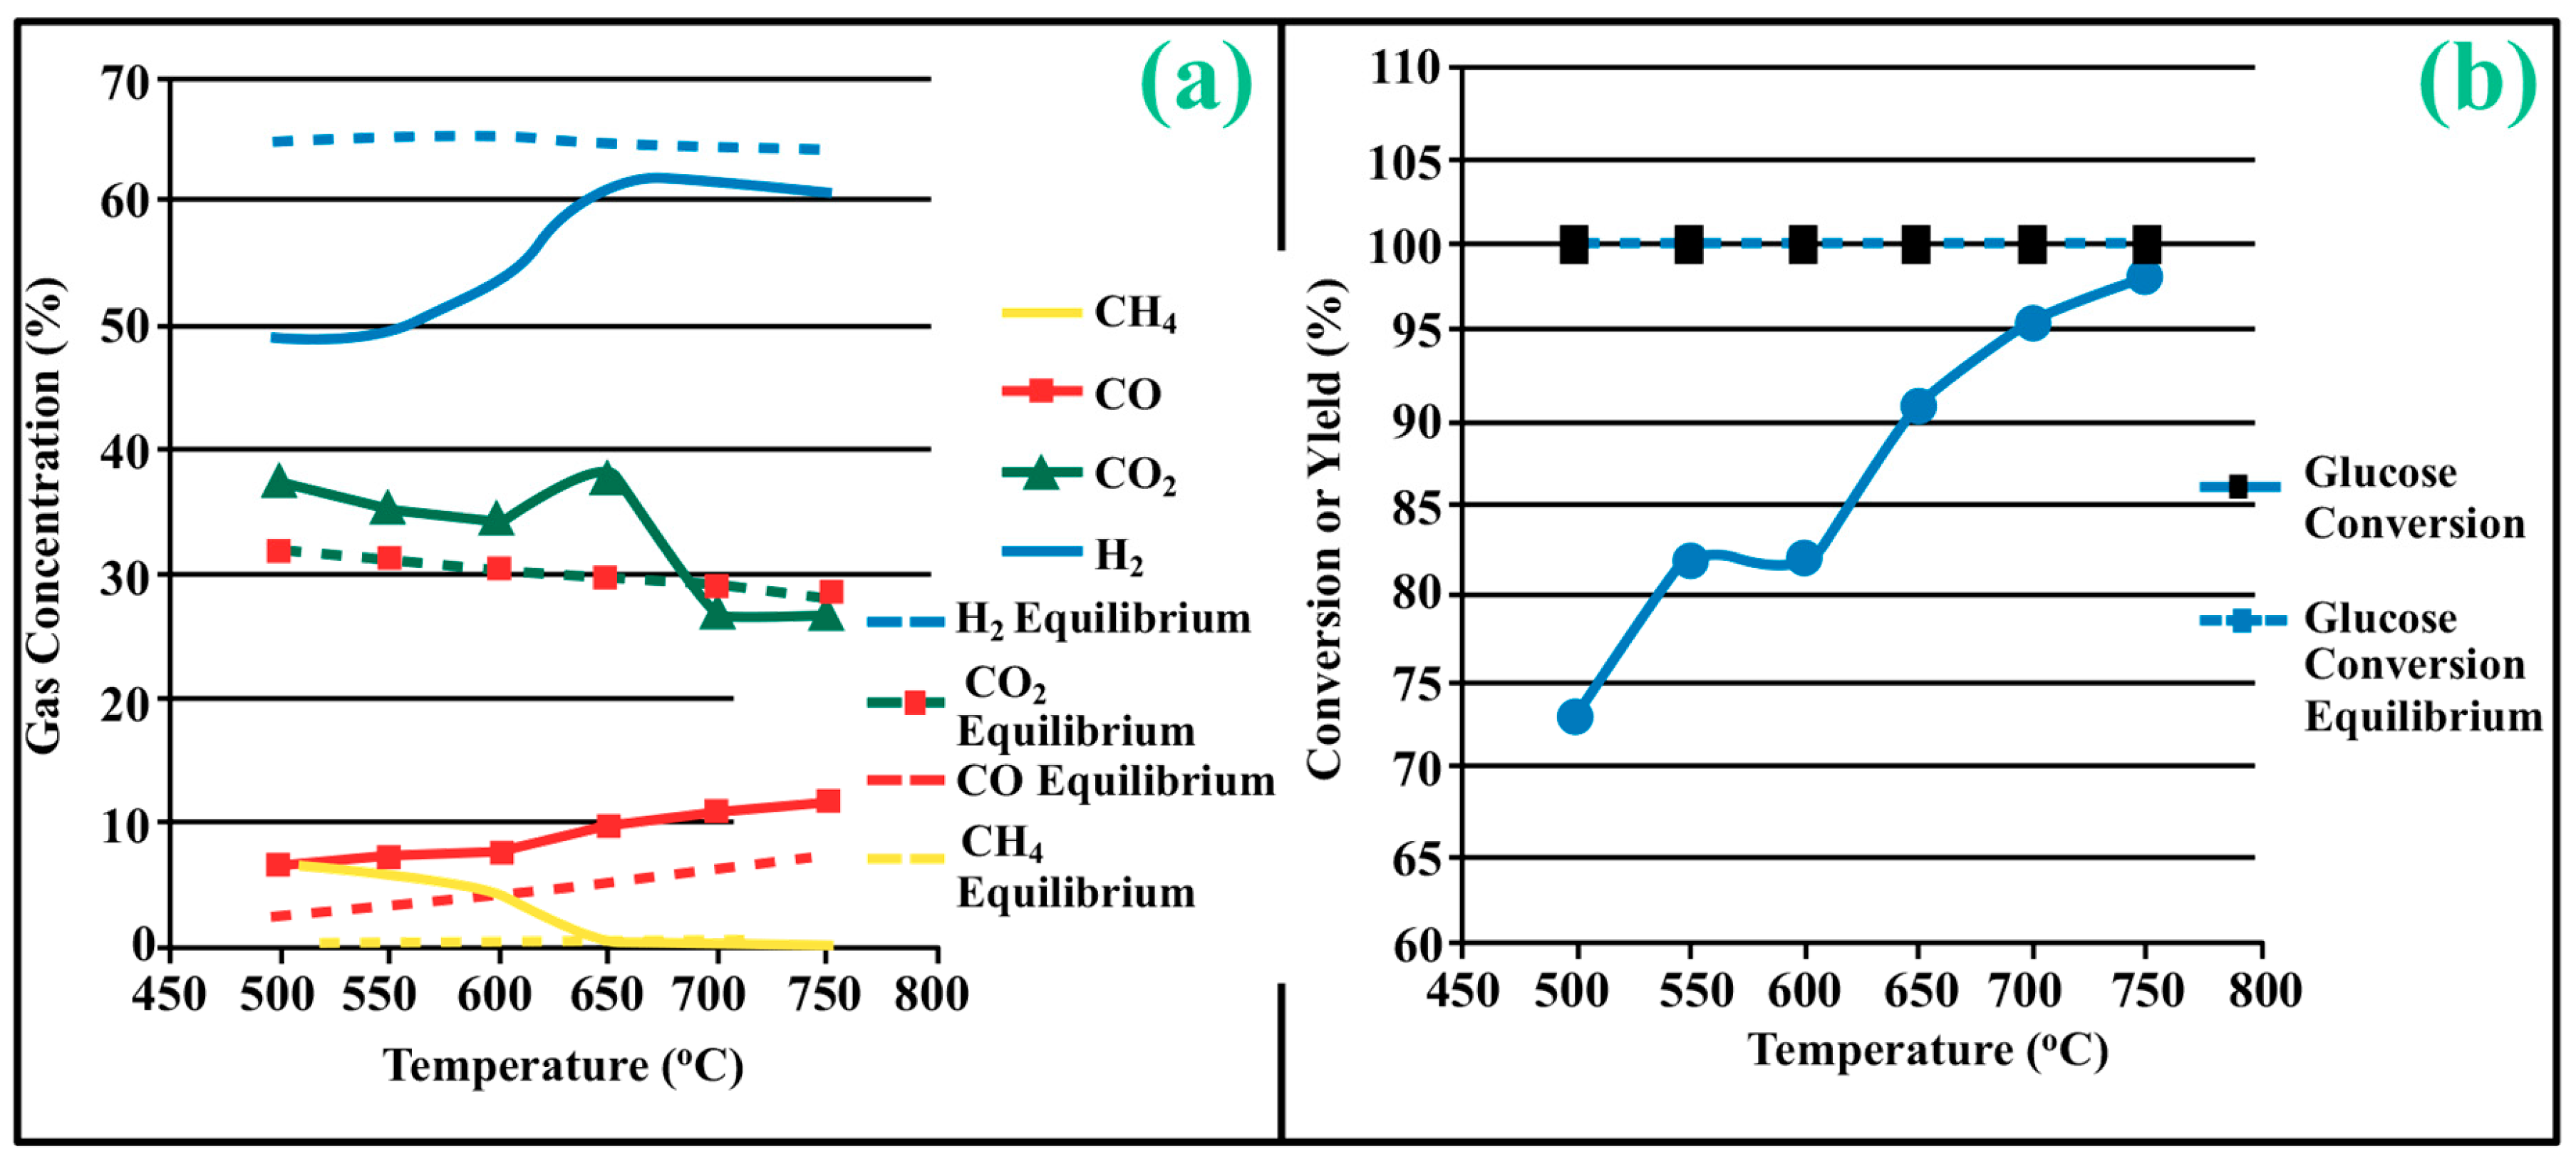
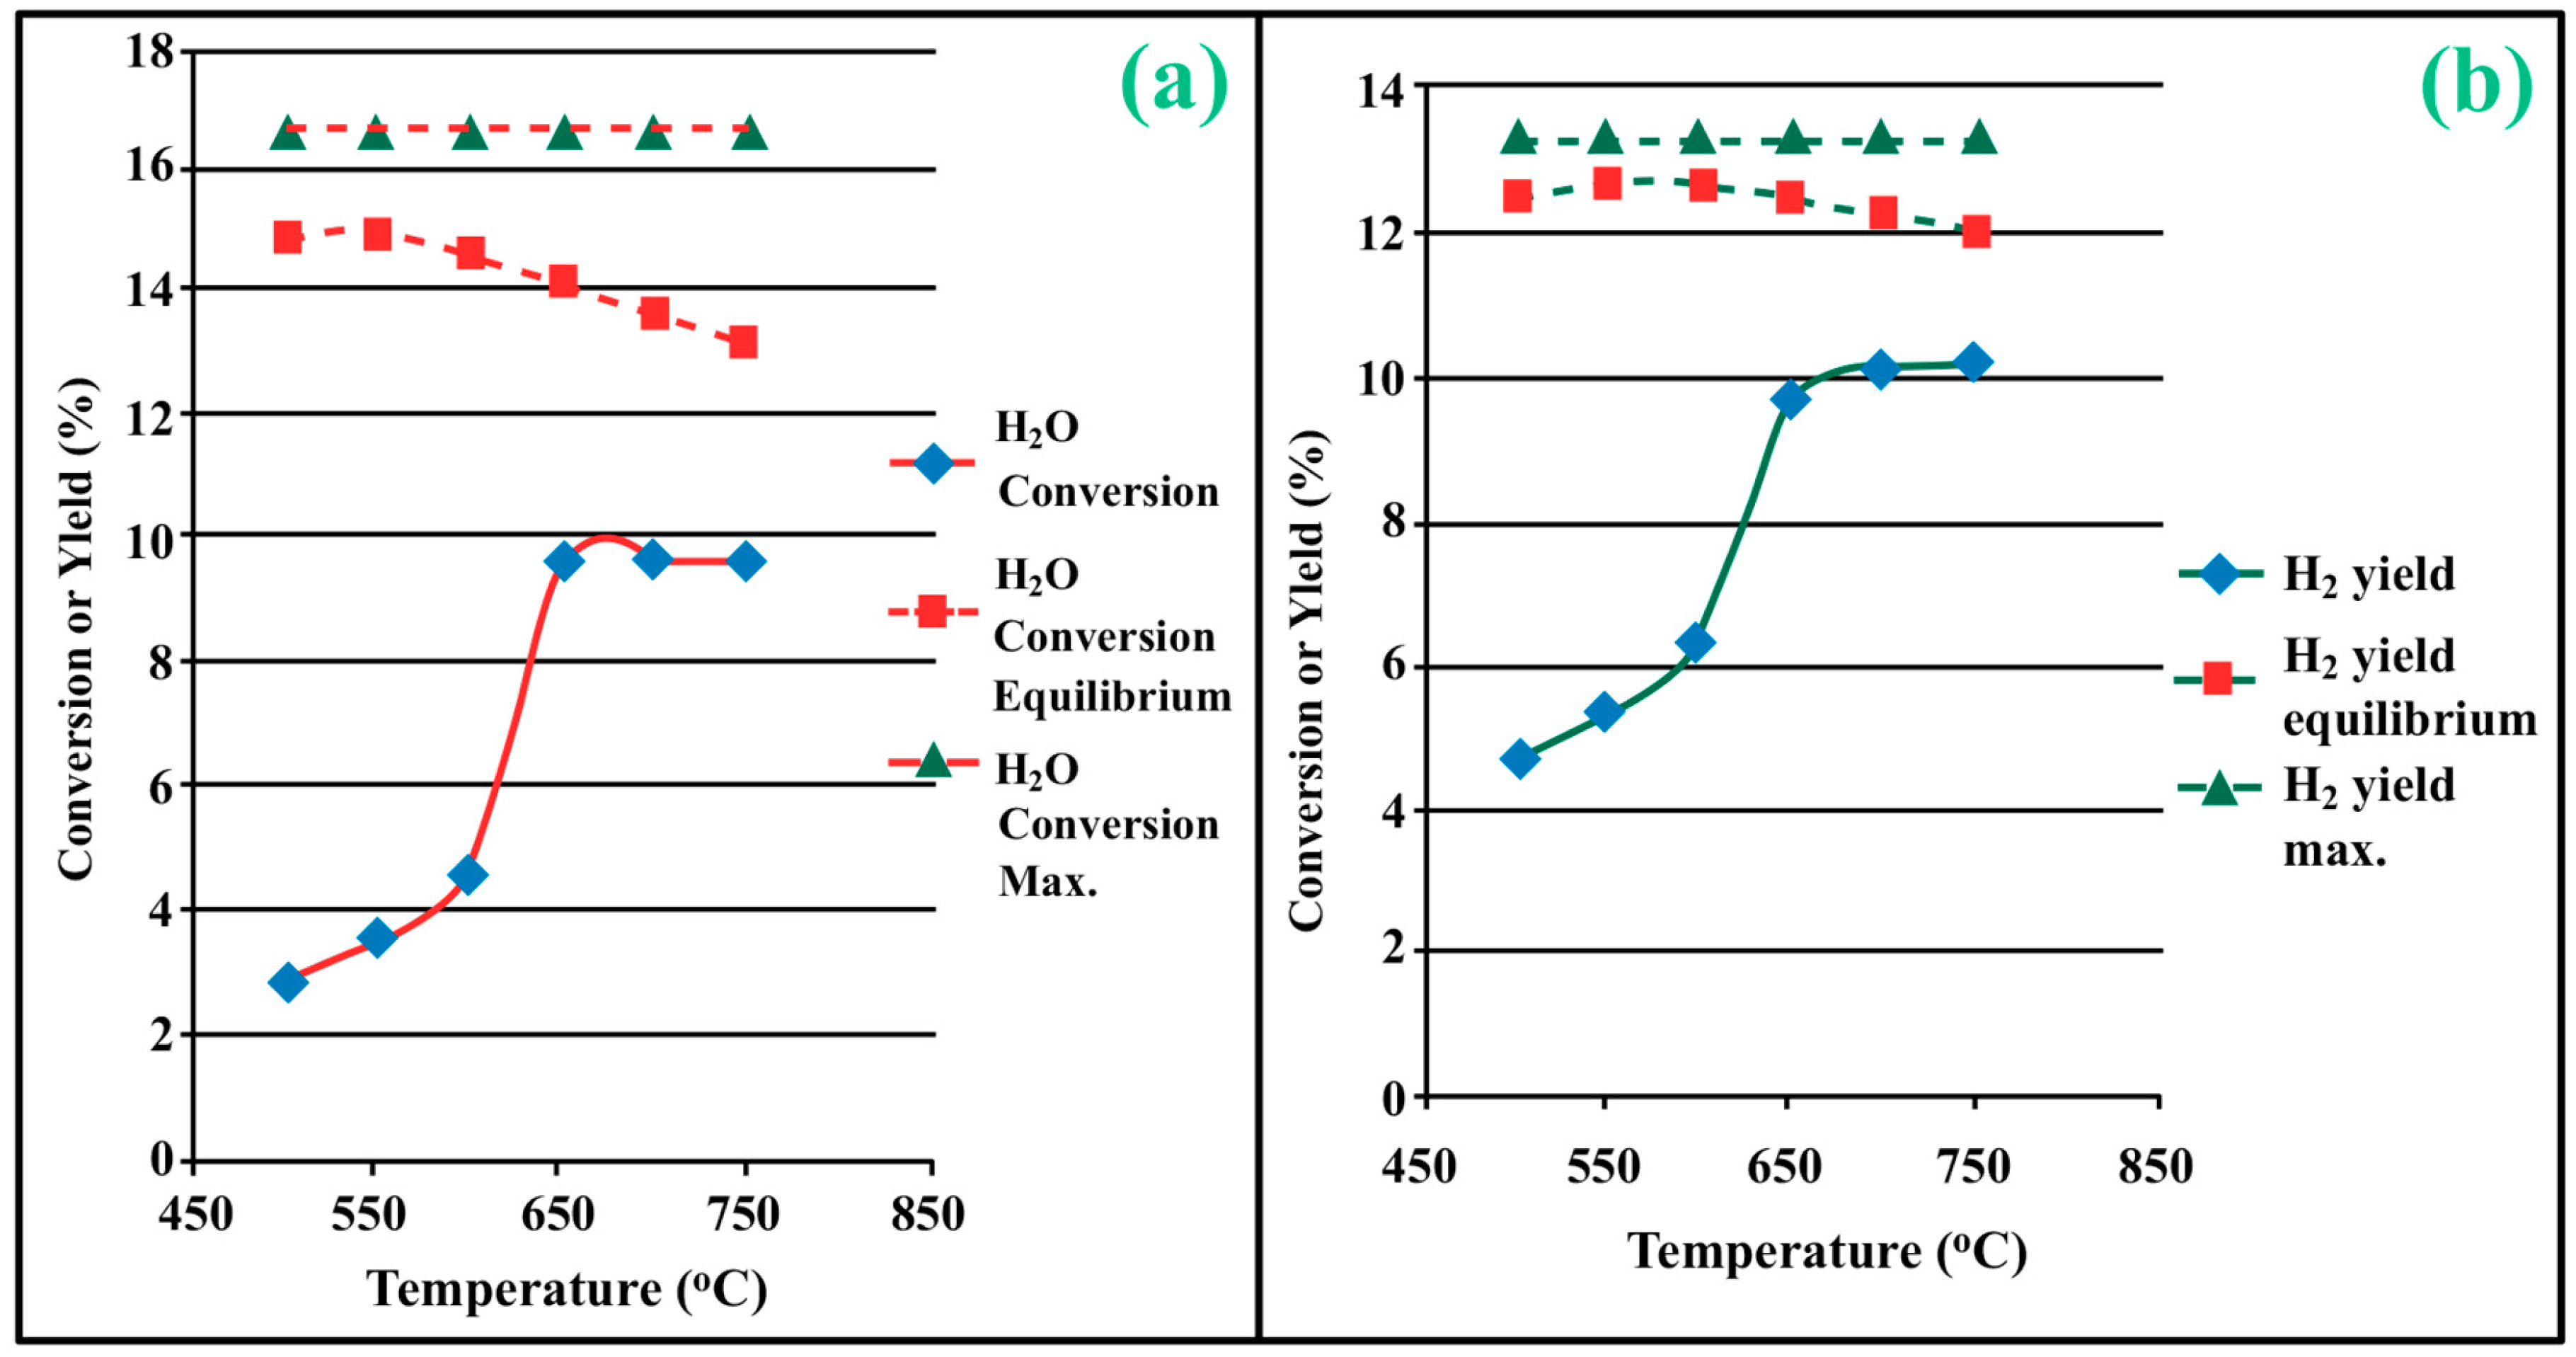
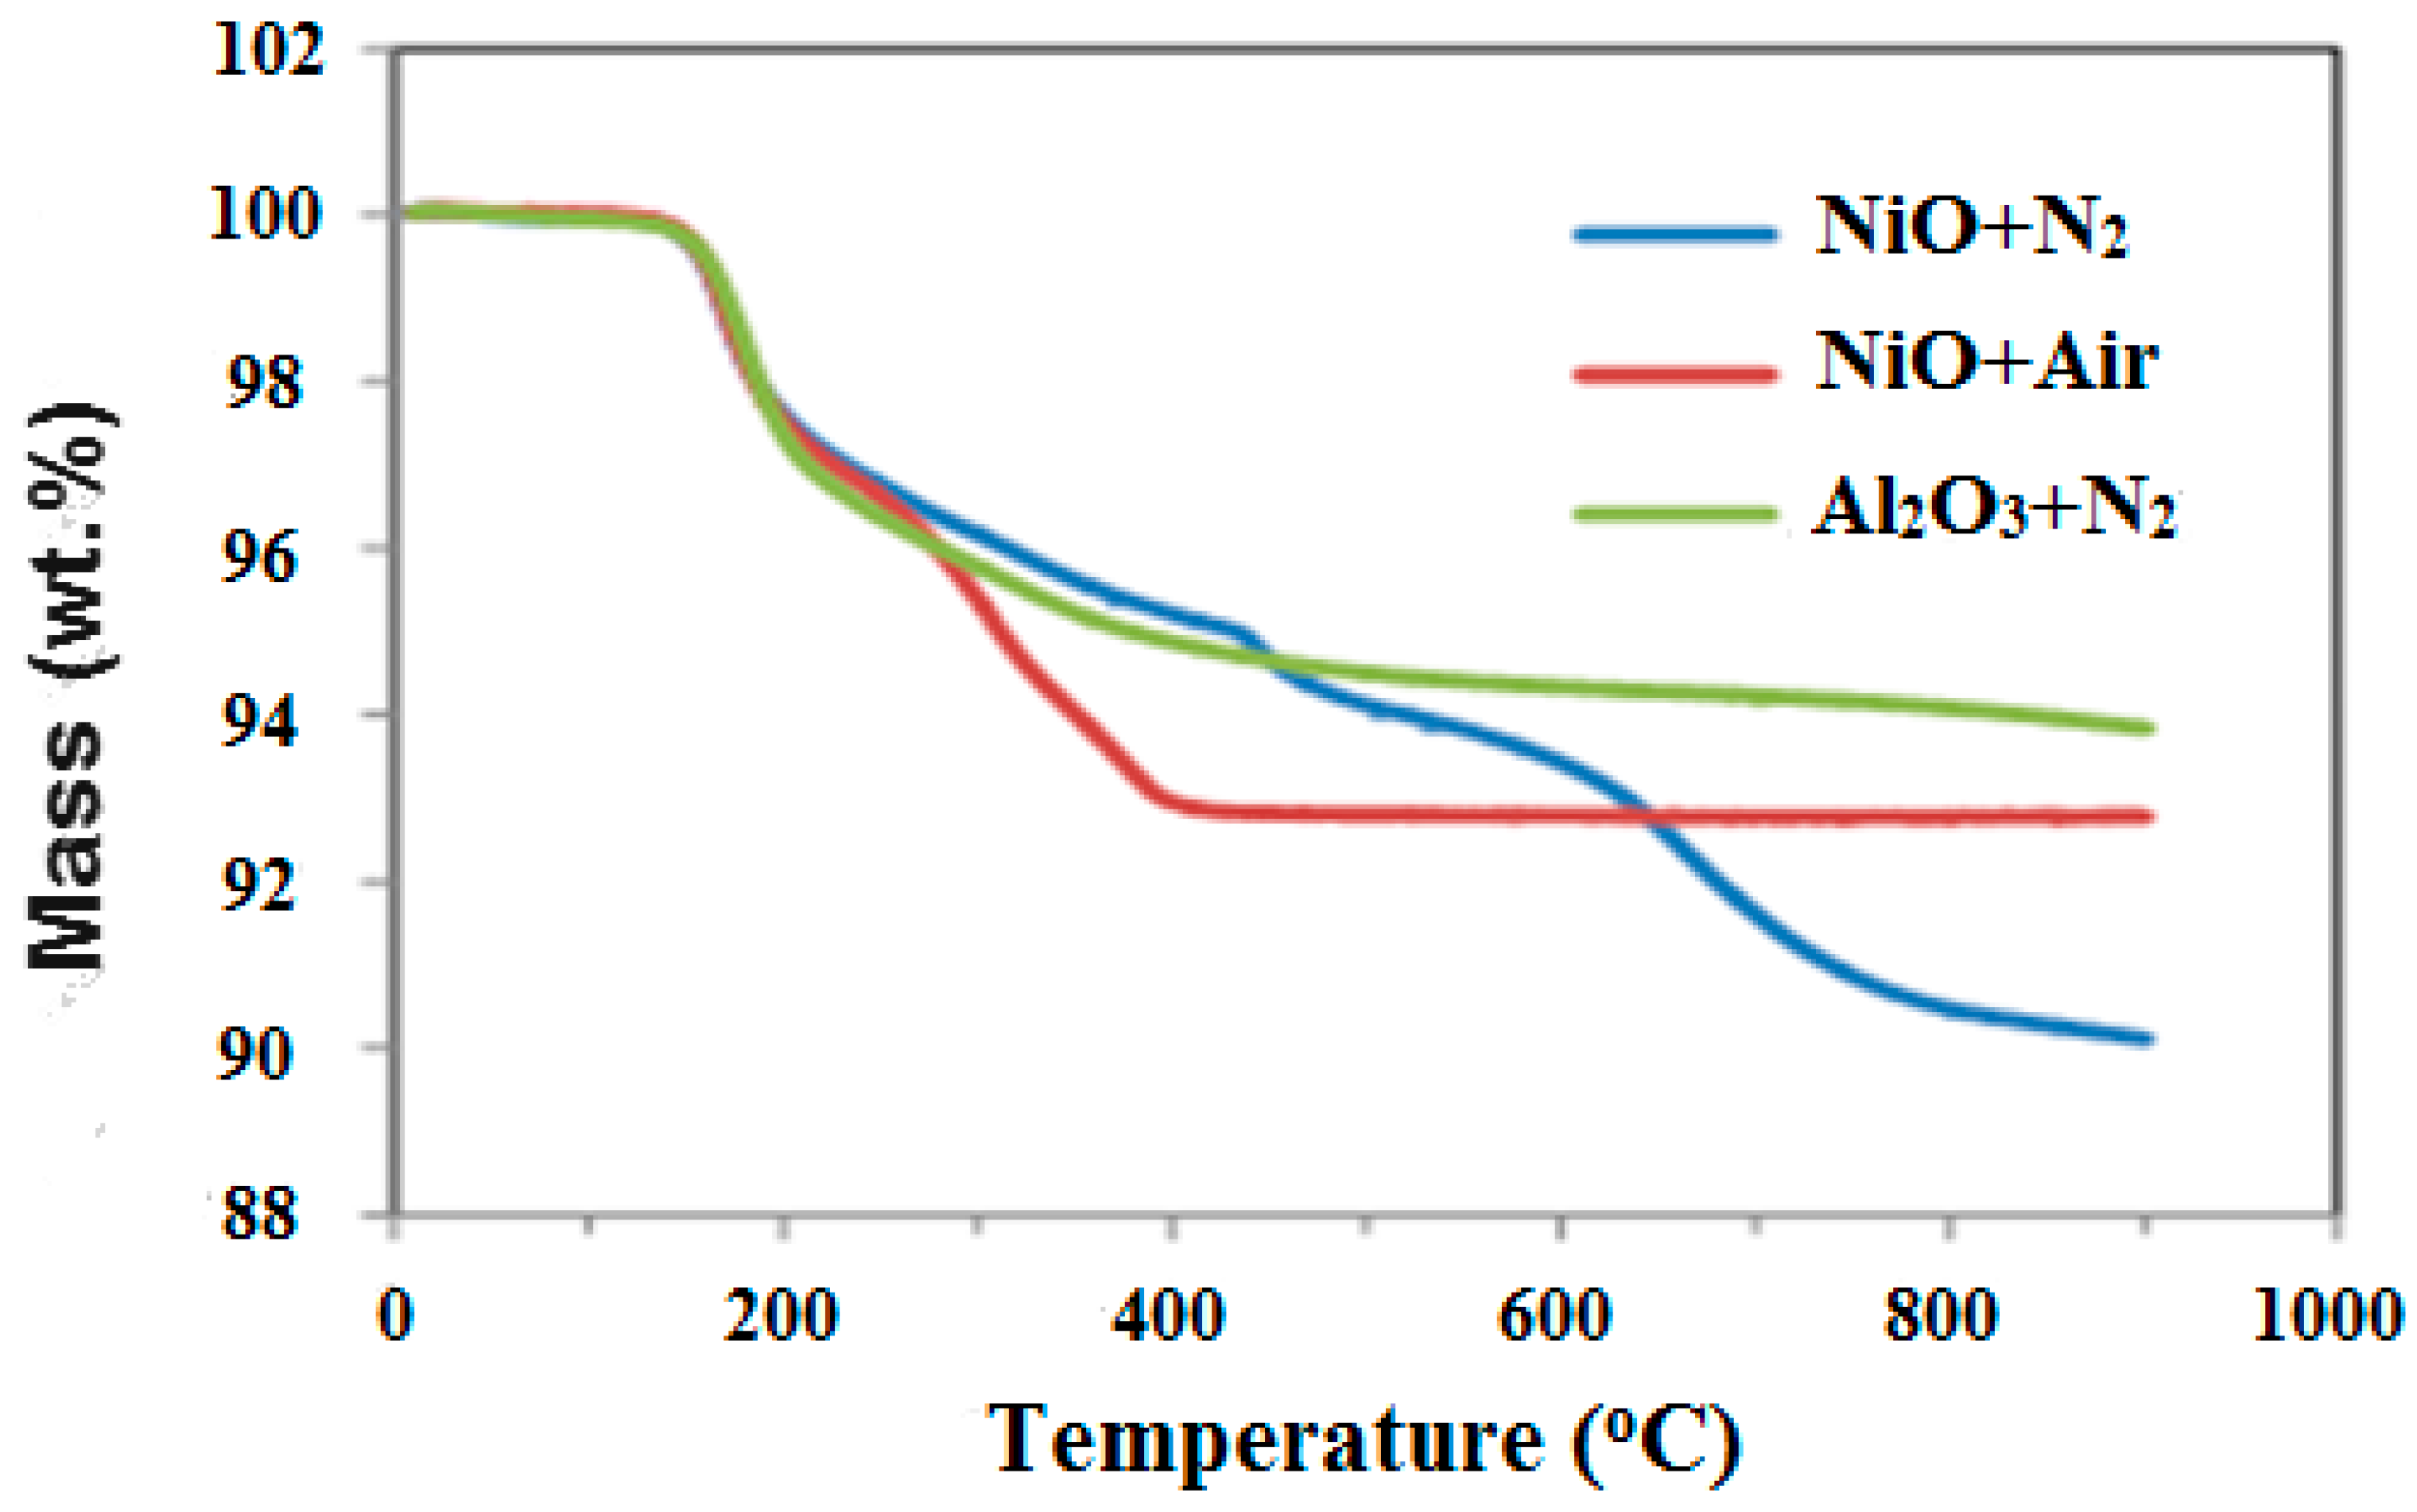
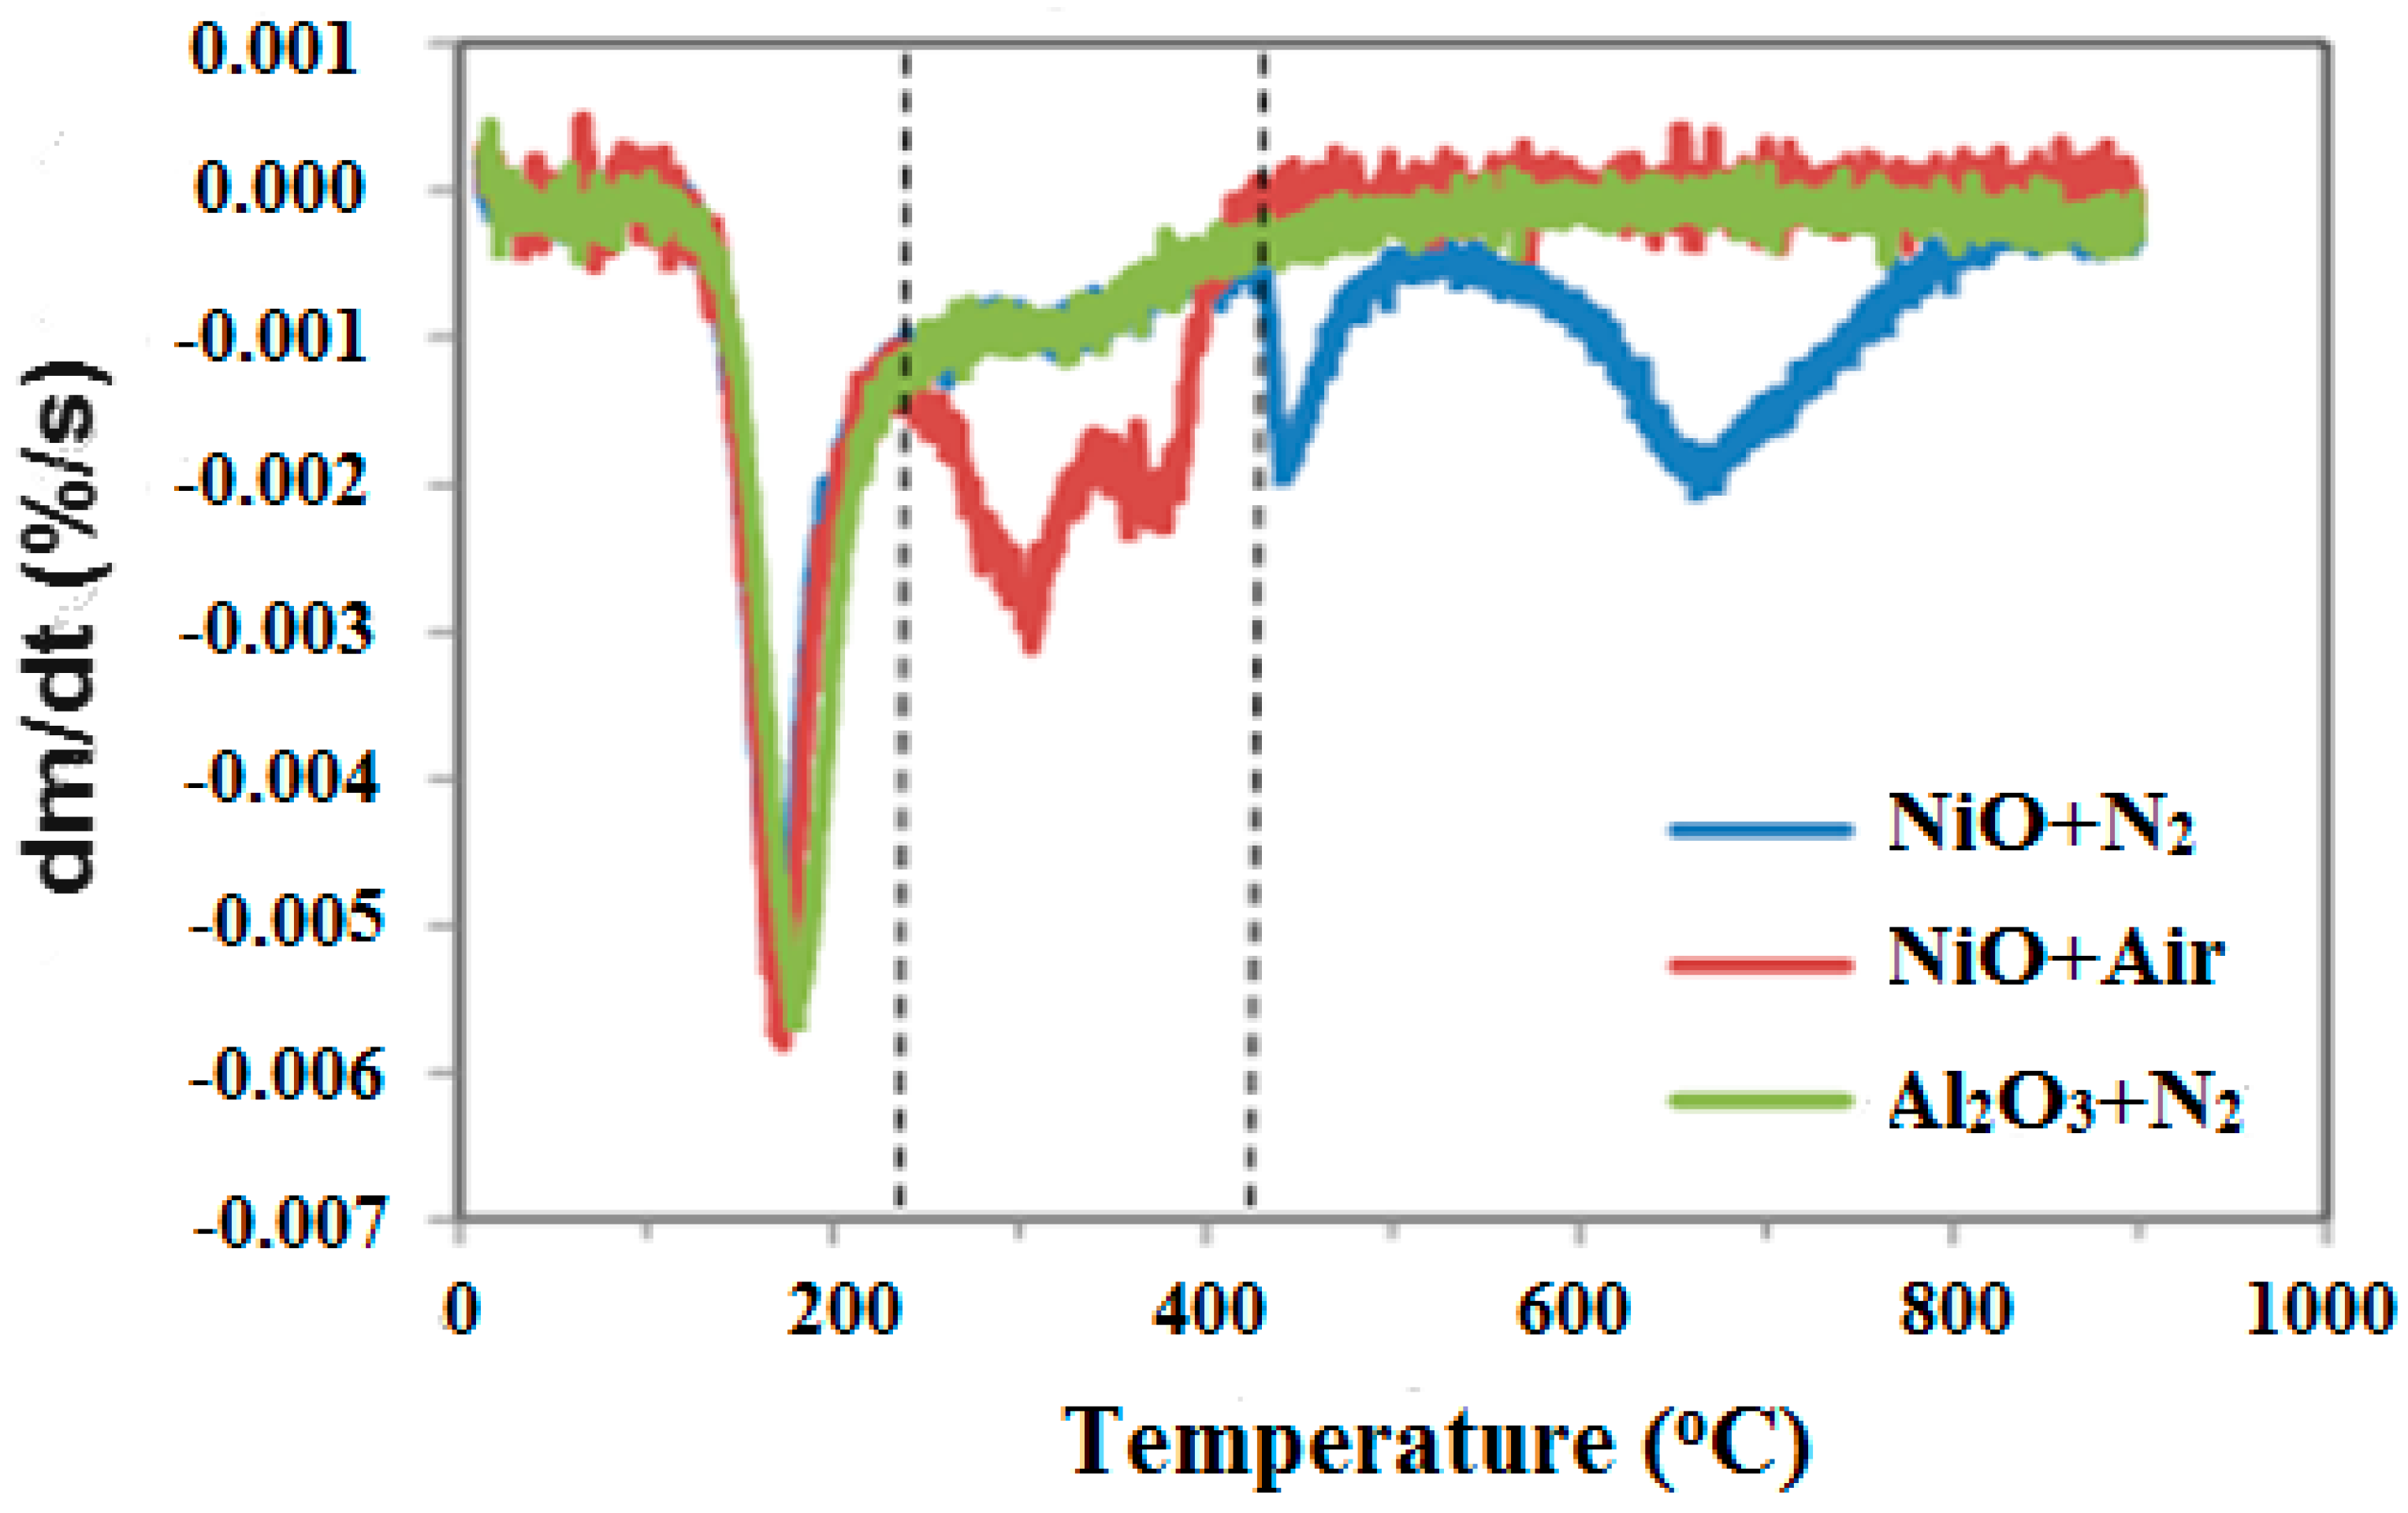
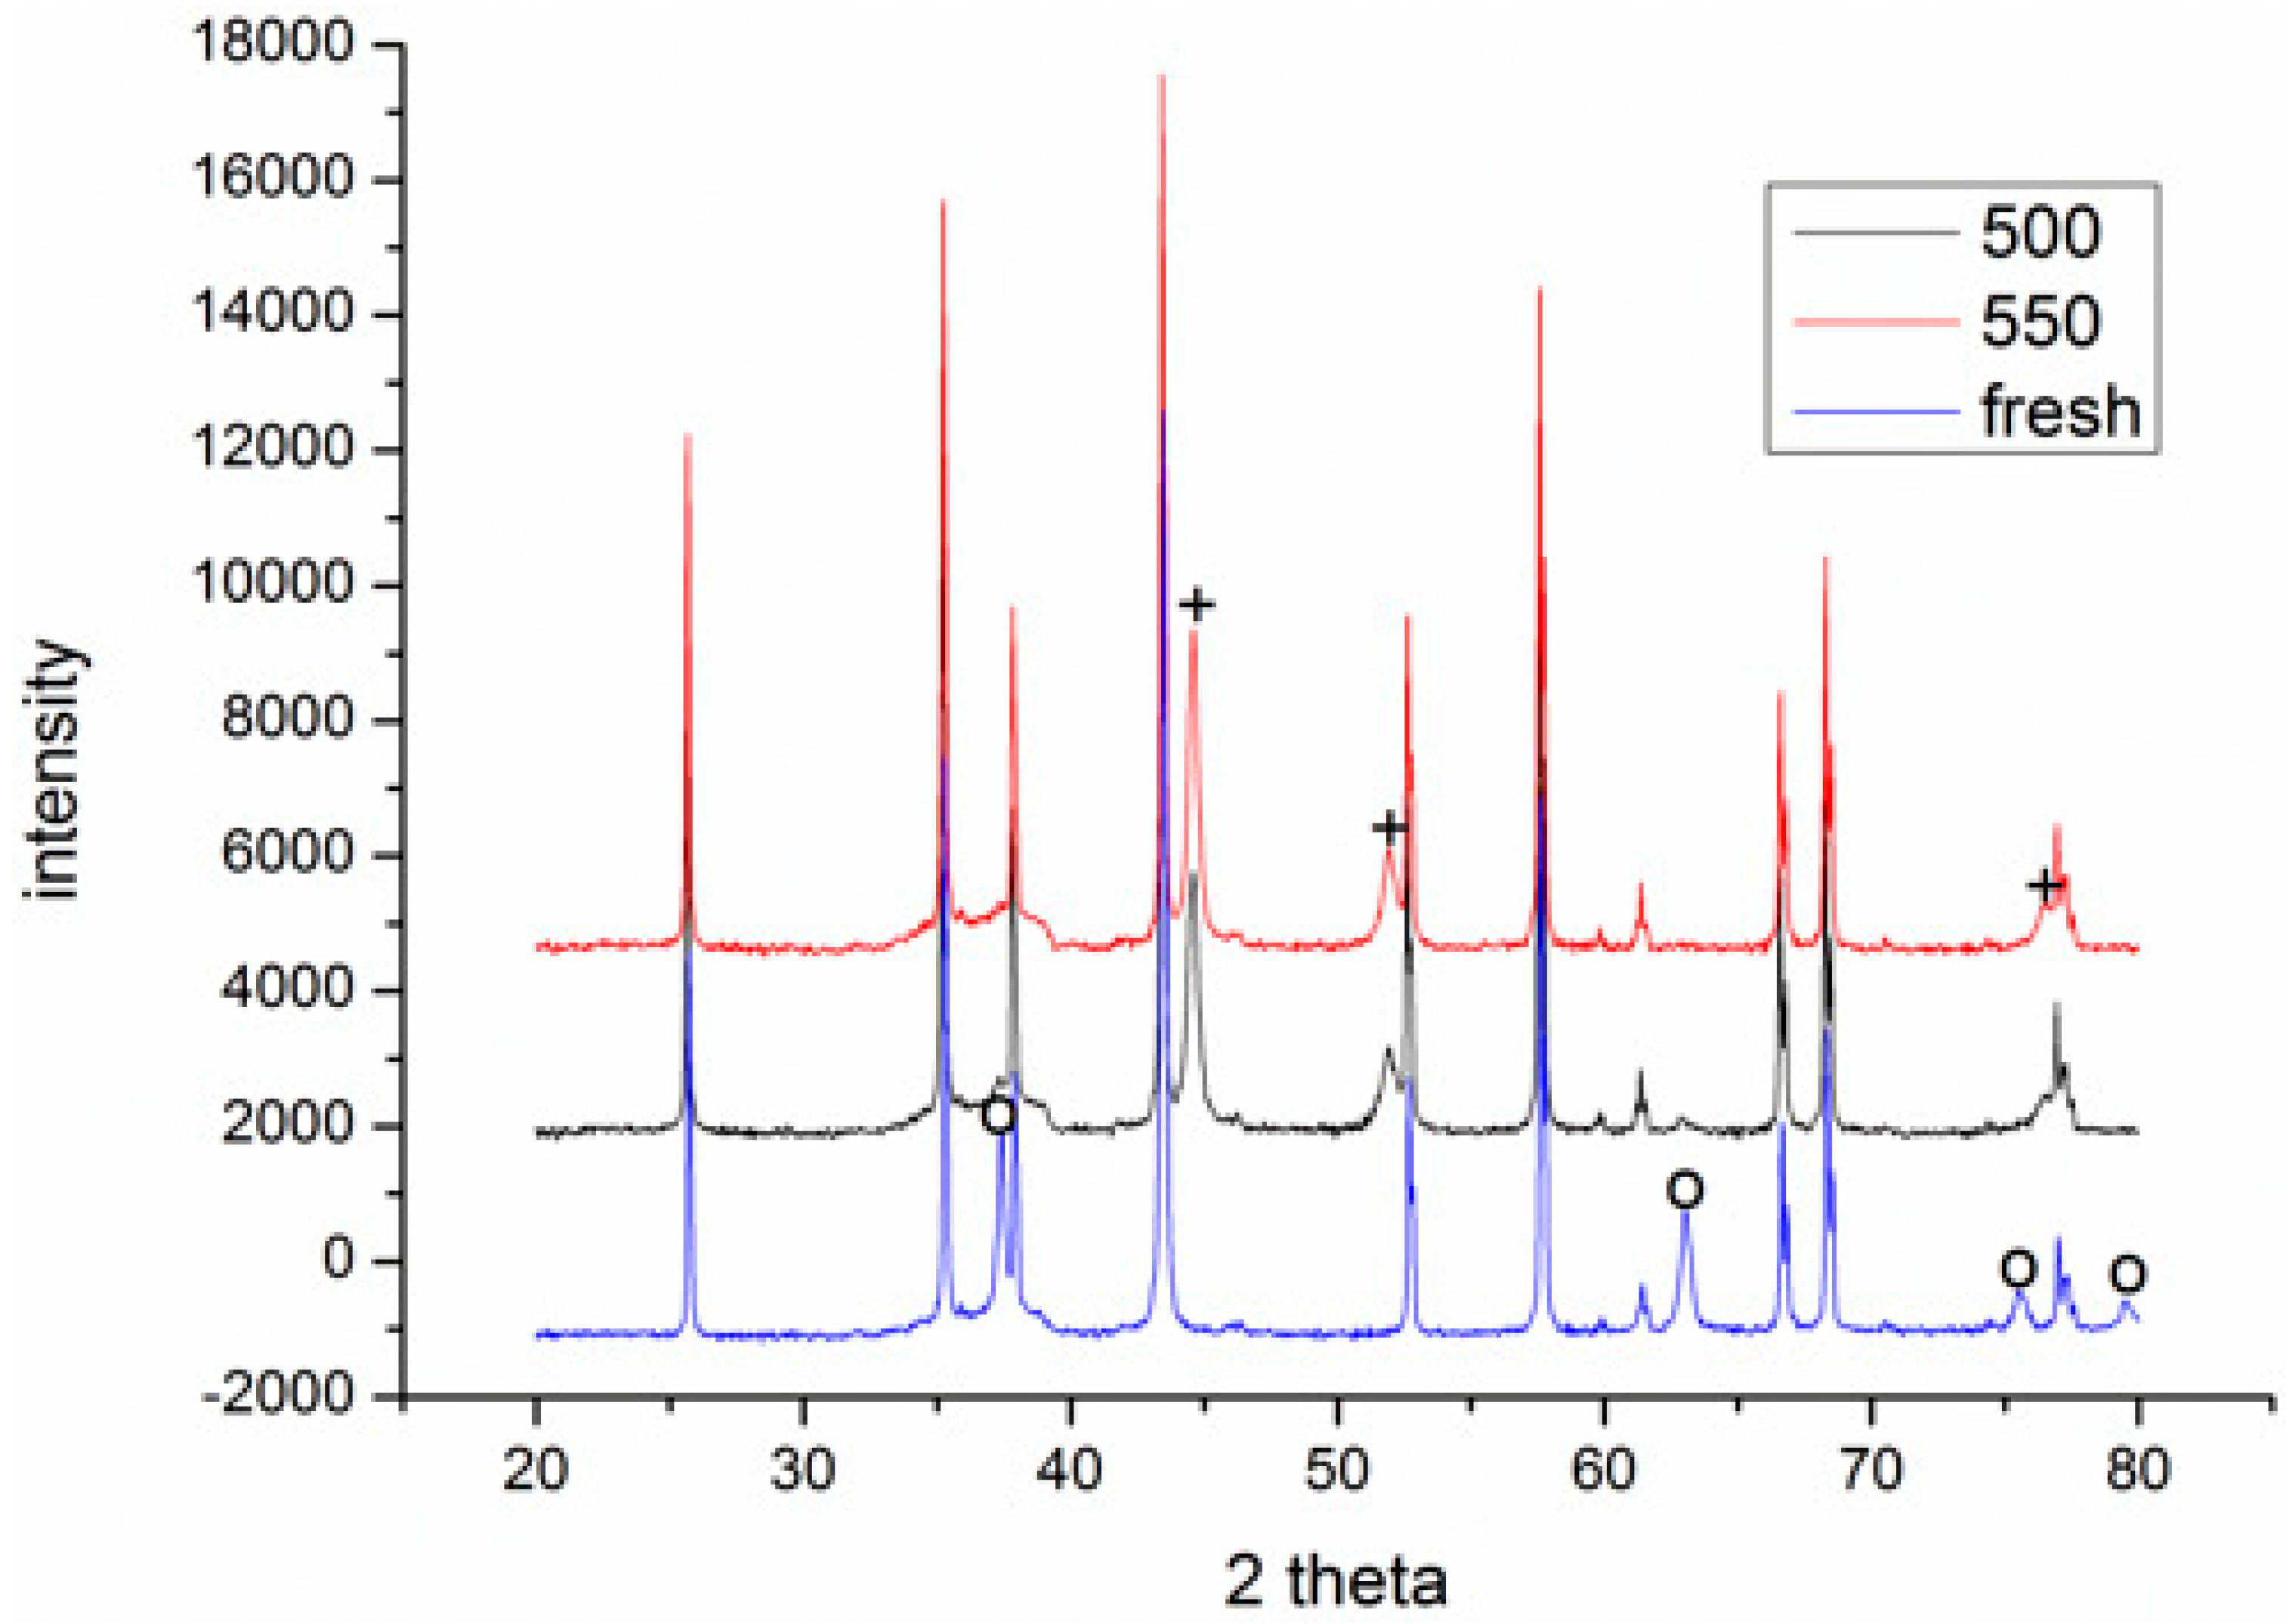
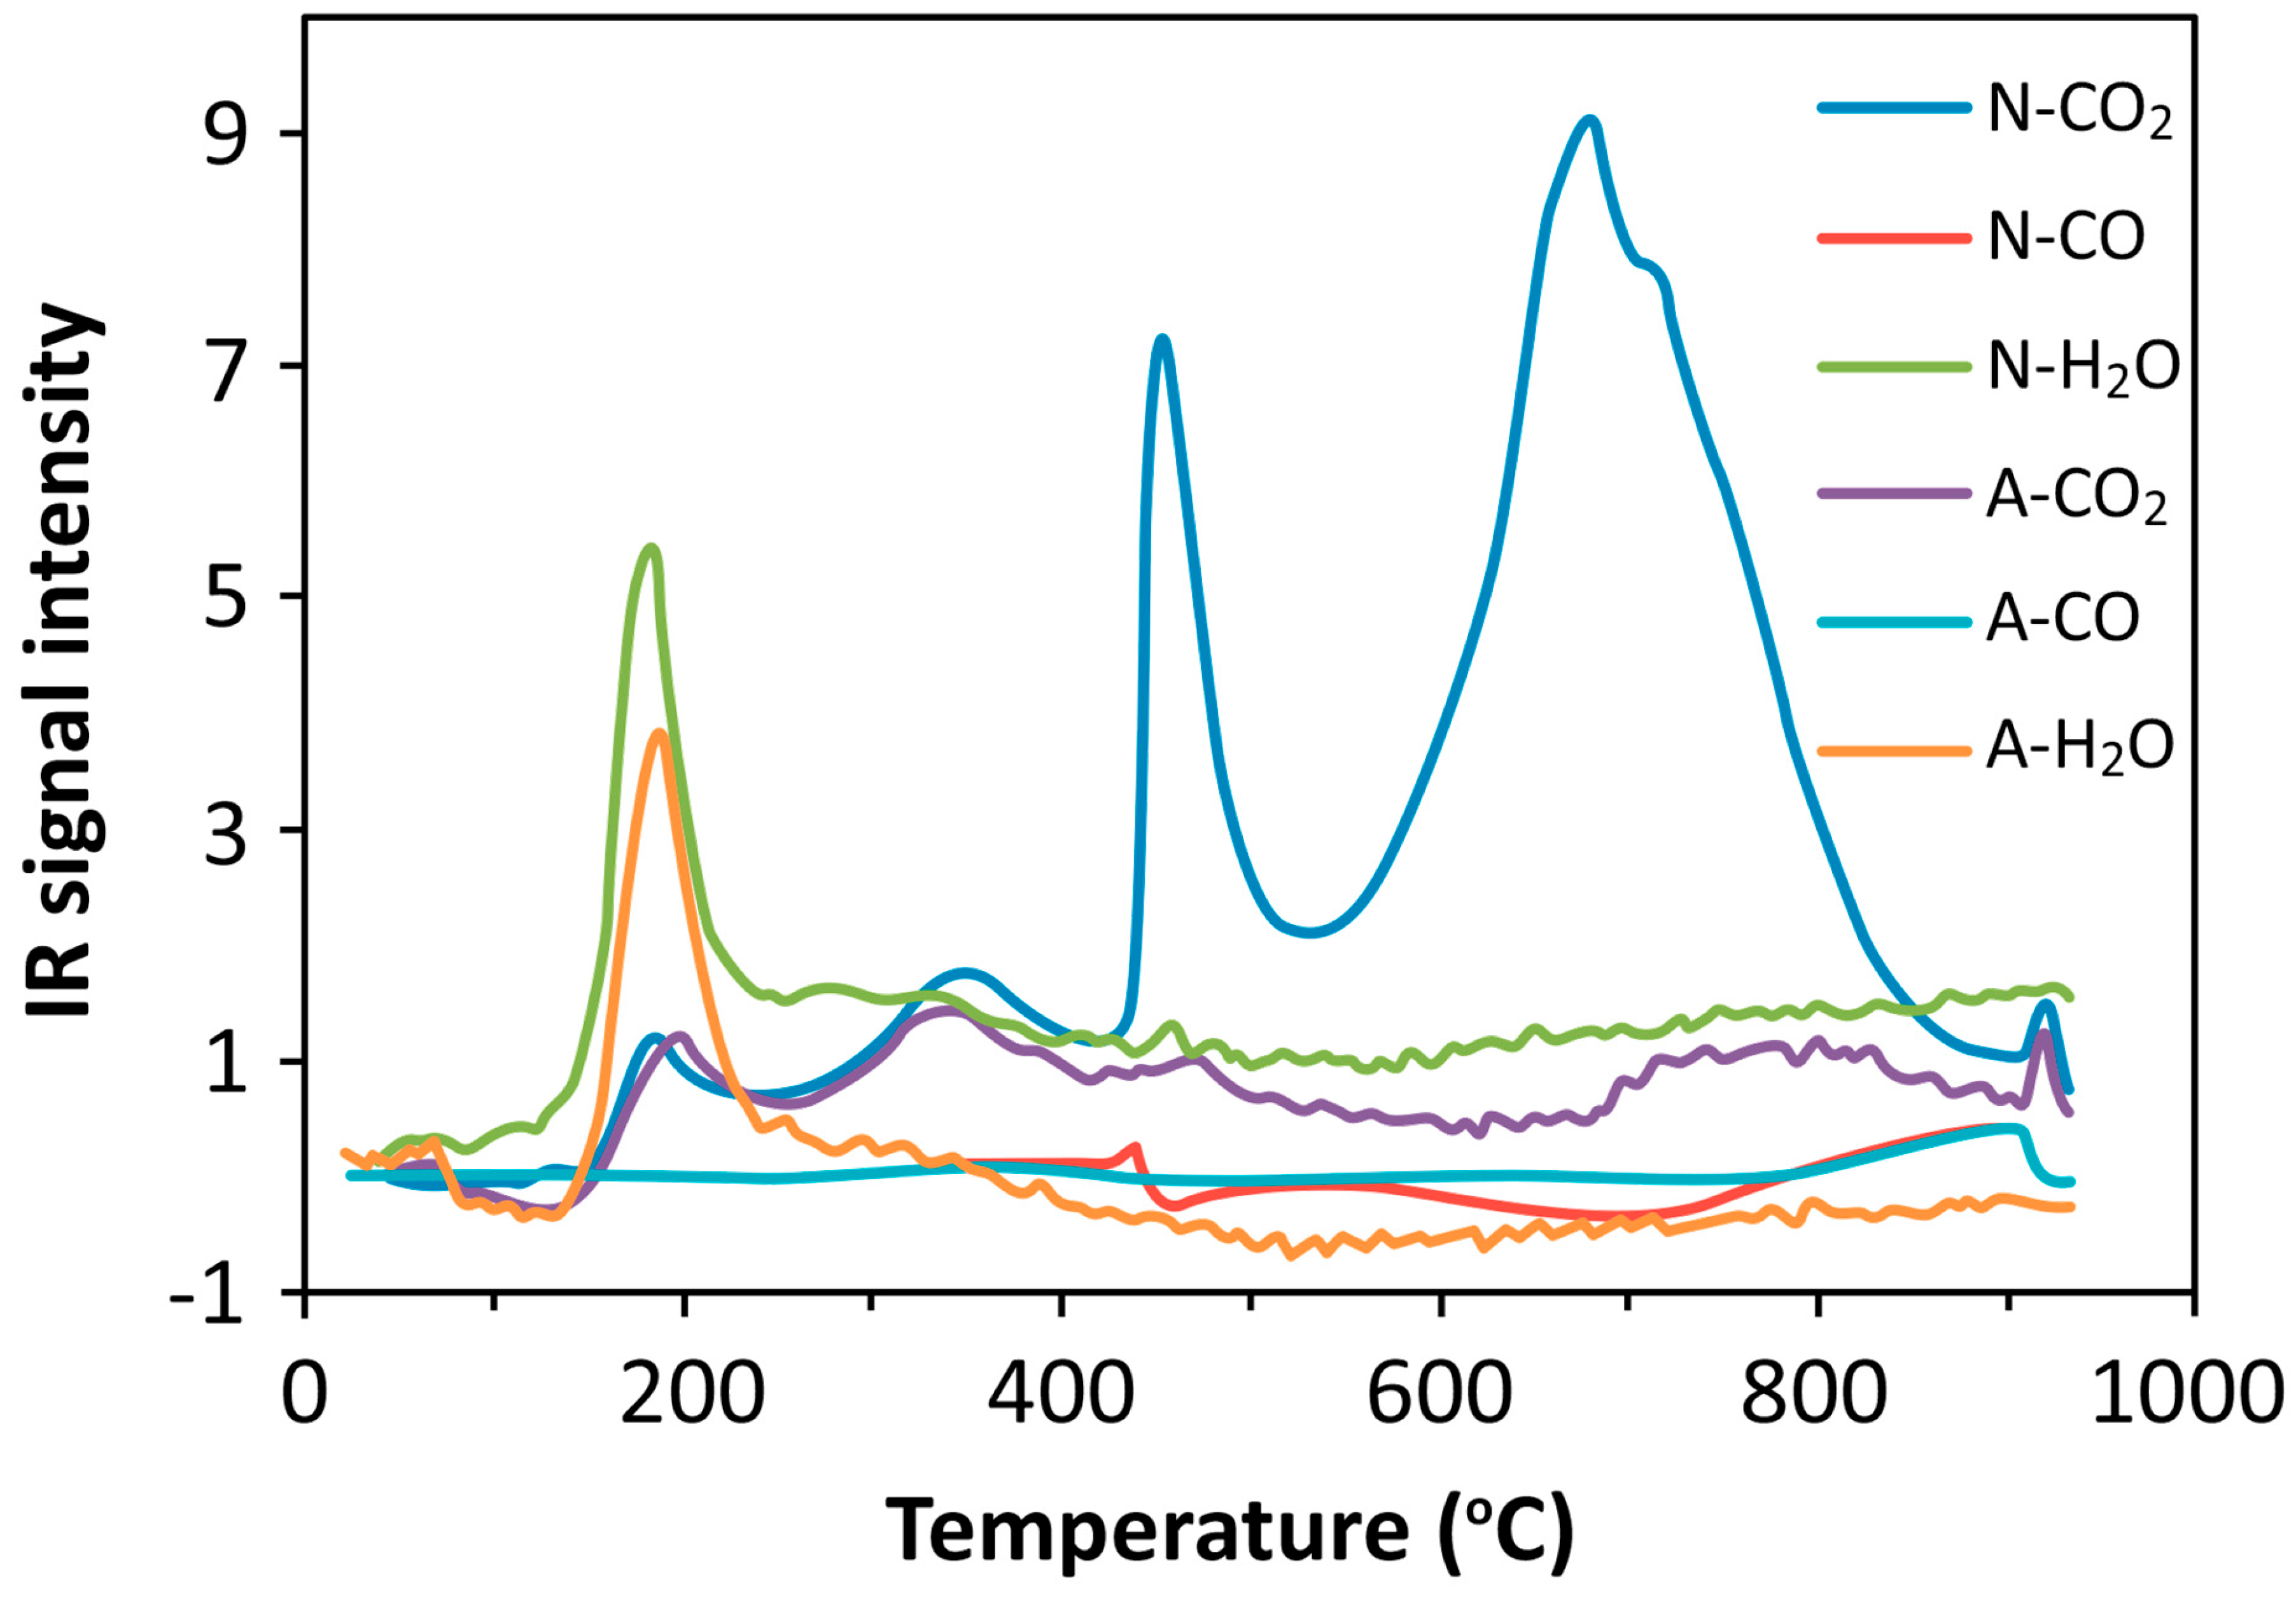
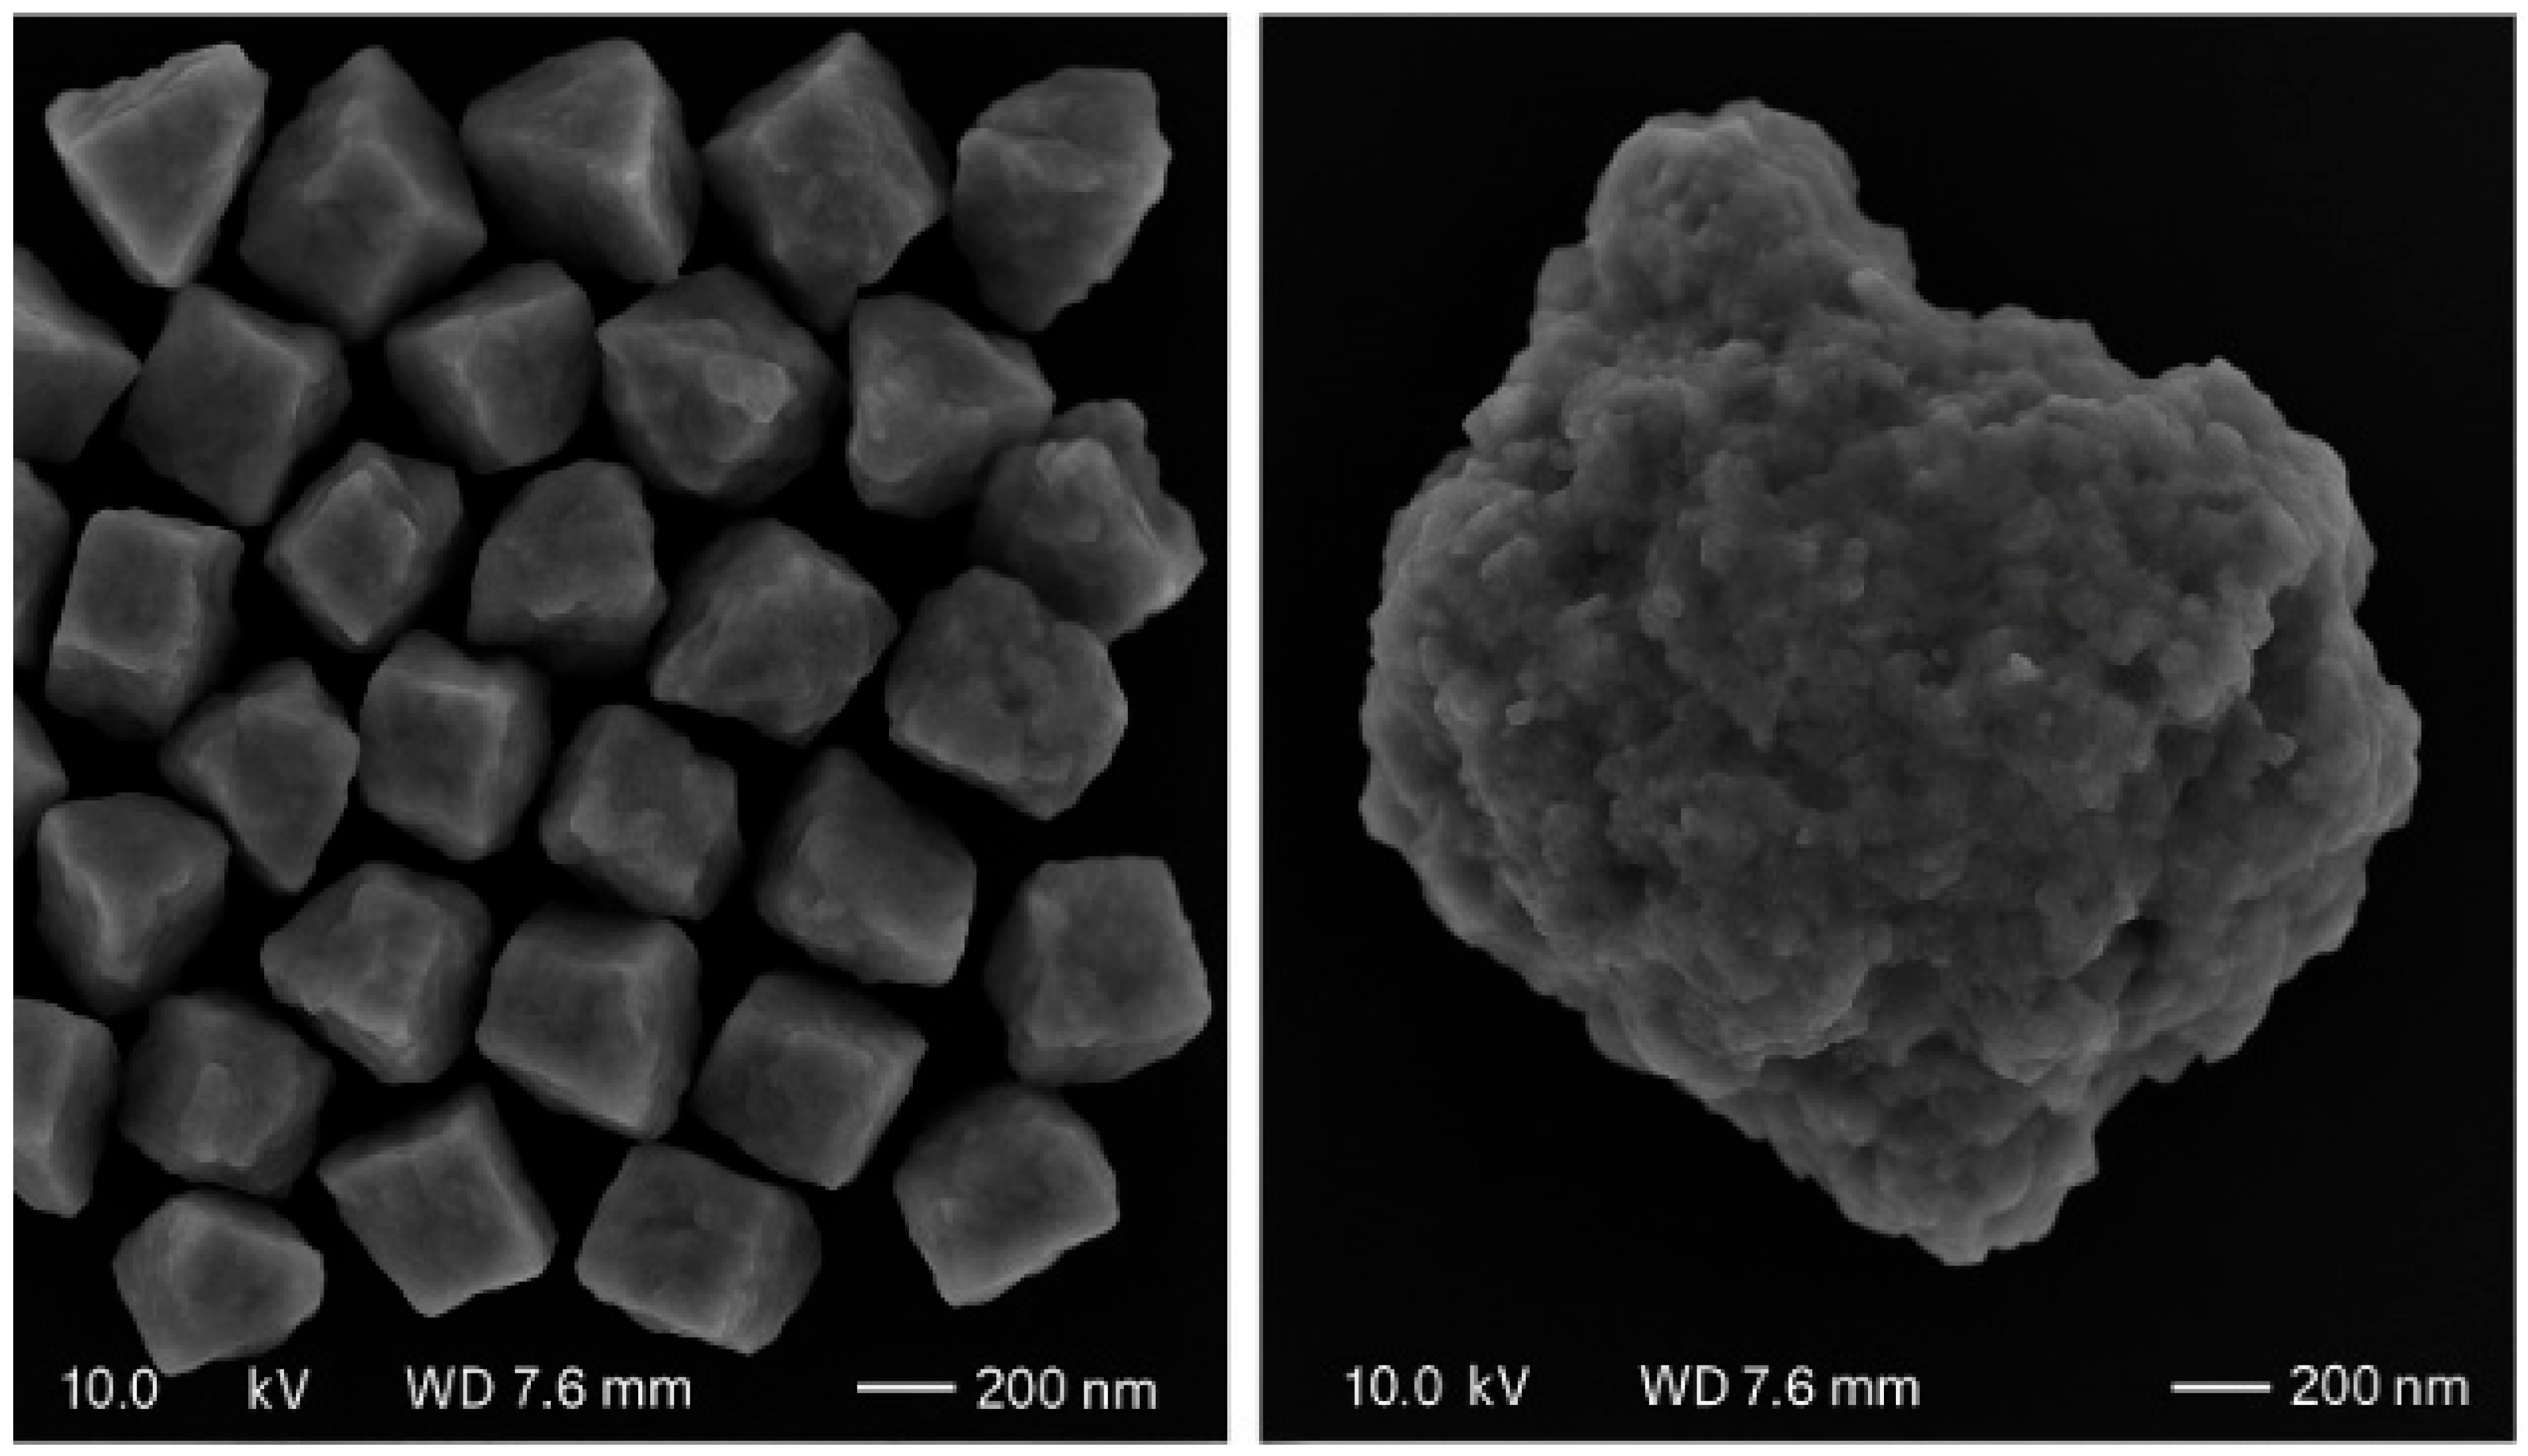
3.1. Process Analysis To describe the reduction process, a combined catalyst reduction and steam reforming experiment at 700 °C with S/C = 6 was selected as a representative example of all the other variables. Figure 3 displays the distribution of gas products across time and feedstock conversions. The initial NiO reduction (Reaction 1) was demonstrated by the generation of H2O, which resulted in a negative H2O conversion (Figure 3B), as well as by the high concentration of CO2 in the gas products (Figure 3A). Figure 4 shows the reduction rate. In Figure 3, the production plateaus of H2O and CO2 are recognizable. It corresponds with the findings of earlier research on the reduction of NiO using bio-oil [22], waste tires [23], and acetic acid [24]. Due to the constant generation of Ni catalyst, the concentration of H2 and CO indicates that the rate of steam reforming increased linearly. Subsequently, the concentration of the gas product and the conversion of feedstock flattened off after 4800 s, indicating that the reduction of NiO had been achieved, and the steam reforming as well as water gas shift reaction became stable. 3.2. Effect of Temperature on the Reduction of Catalyst at S/C of 6 In this work, the reduction of NiO to Ni by glucose solution was examined at different temperatures and S/C ratios. XRD, TGA-FTIR, and SEM analysis were used for characterizing the reduced Ni catalyst. Figure 5A shows the external appearance of fresh NiO before reduction, while Figure 5B–F shows the external appearance of the reacted Ni catalyst at temperatures of 500, 550, 650, and 700 °C, respectively (when S/C = 6). Between the temperatures of 500 and 650 °C, the reacted catalysts were in particulate and agglomerated forms. However, it was observed that increasing the temperature to 700 °C causes the catalyst to exist solely in particulate form. Henceforth, these two forms of reacted catalysts are denoted as particle sample and agglomerate sample. Moreover, the minimum temperature for feasible reduction was determined by using XRD analysis of a fresh NiO sample and the reduced catalyst at 500 and 550 °C. 3.3. Carbon Deposition Moreover, Figure 6 shows the Chemigram profile of the particle sample (left) and the agglomerated sample (right) at 500 °C. The FTIR analysis of the Ni particle catalyst at 500 °C (left) shows no traceable pattern of CO and H2O throughout the process apart from that of CO2. The emission of CO2 starts at a temperature between 200–680 °C, but at a constant temperature of 400 °C, there was a very strong CO2 signal peak. Also, at a temperature at 650 °C, there’s a small peak of CO2. The carbon species, which are the oxides at lower temperatures, exist in amorphous and filamentous form. Note that the carbon species that are oxidized at a very high temperature usually exist in a graphite-like crystallite form [25]. The deposition and formation of an amorphous form of carbon on the surface of the reacted catalyst can easily cover the active site and therefore deactivate the catalyst [26]. Moreover, the existence of two CO2 peaks during the TPO of the used catalyst has been reported by Rihm et al. (2023) [27]. 3.4. Performance of Steam Reforming The steam reforming process and integrated catalyst reduction have been examined at S/C = 6 at different temperatures. From the reformate, only CO, CO2, H2, and small quantities of CH4 are detected. Figure 7 shows the steam reforming performance of glucose with respect to temperature. From the graph plot in Figure 7a, the purity of H2 increases with an increase in temperature up to 650 °C, after which the concentration becomes stable. Methane concentration dropped to approximately zero with the increase in temperature. Simply because of the improvement of CH4-steam reforming over the methanation reaction (endothermic). There is also a decrease in CO2 with an increase in temperature and an increase in CO with an increase in temperature until 650 °C, after which their concentration stabilizes to 750 °C. The reaction is exothermic, where the increase in temperature suppresses the reaction to give up more CO2. In the meantime, the replacement of both Boudouard and water gas shift reactions led to an increase in the concentration of CO and a decrease in the concentration of CO2 [27]. Figure 8 illustrates the conversion of glucose, as well as the yields of water and hydrogen, in relation to temperature. With temperature increase, the conversion rate of glucose increases rapidly up to 700 °C, after which the conversion rate stabilizes. Even with a further increase in temperature, the conversion rate will not go further, and the glucose conversion rate achievable would be 96%. The conversion of water linearly increases with the increase in temperature and then becomes stable at a temperature of 700 °C (with the conversion rate of 10%). Similarly, H2 yield increases with the increase in temperature and then stabilises at 700 °C (with 10.11% yield rate). 3.5. Comparison of Thermodynamic Equilibrium Data with Experimental Results The dashed line in Figure 7 and Figure 8 illustrates the thermodynamic equilibrium data for glucose steam reforming at different temperatures at S/C = 6. The conversion of glucose reaches 100% at equilibrium, as shown in Figure 9. According to Le Chatelier’s principle, an increase in temperature favors an endothermic steam reforming. Similarly, an increase in temperature does not favor the exothermic water gas shift, but favors an increase in steam content. However, the undesirable effect of temperature on water gas shift causes a small decrease in H2 yield at equilibrium. As a result, water is converted from 650–750 °C when S/C is kept at 6. In Figure 7, there is a lower H2 yield, glucose conversion, and water conversion, based on the experimental data compared to the equilibrium data. The key reason for the difference between the two data sets is the kinetic control of the steam reforming reaction. 3.6. Characterization 3.6.1. Trends Illustrated by TGA The behavior of mass loss of NiO is almost the same as that of Al2O3 under N2 at the beginning of 430 °C, as shown in Figure 9 and Figure 10. However, after 430 °C, there was a slight mass drop in Al2O3, whereas the NiO sample experienced two important mass losses. This shows that the variation occurred at a temperature below 430 °C. Subsequently, NiO plays a significant role in the reaction when the temperature is >430 °C. Generally, the composites that exist in bio-oil (bio-oil compounds) belong to one of these chemical groups: alcohols, hydroxyaldehydes, ketones, carboxylic acid, furan, and phenolic. Certain phenolic compounds, such as oligomeric proanthocyanidins, typically exist as oligomers with molecular weights ranging from 900 to 2500 Da. While sugar, ketones, alcohol, hydroxyaldehydes, and carboxylic acid are derivatives of carbohydrates, they are very soluble in water. Furans are from lignin and are hydrophobic. 3.6.2. XRD, FTIR, and SEM-EDX Images/Graphical Illustrations In Figure 11, the fresh NiO catalyst is represented by the blue patterns, while the reduced catalysts at 500 and 550 °C are represented by the black and red patterns, respectively. Similarly, the characteristic of NiO is marked as (O), the characteristic of Ni is marked as (+), and the blank pattern is Al2O3. The XRD analysis of the catalysts identified three constituent compounds—Al₂O₃, NiO, and Ni—as the only phases present in the samples. Essentially, (O) characteristic peaks of NiO, (+) characteristic peaks of Ni, and the blank peak characteristics are attributed to α-Al2O3. Therefore, using the Rietveld refinement method for the reacted catalyst at 500 °C, there was 86.6% Al2O3 (pattern no. 04-004-5434), 3% NiO (pattern no. 04-013-0890), and 10.4% Ni (pattern no. 04-010-6148). The weighted R profile and goodness of fitting of refinement were 4.00164 and 3.6599, respectively. Such indicates that the refinement result is reliable and good [28]. The final conversion of NiO calculated is 82%. The incomplete conversion is attributed to the low temperature. The reacted sample at a temperature of 550 °C has 88.7% Al2O3 (with pattern no. 04-004-5434) and Ni at 11.3% (with pattern no. 04-010-6148), with no traces of NiO. Weighted R profile and goodness of fitting of refinement are 4.3944 and 4.4378, respectively. By implication, the refinement result is reliable and good, as the final conversion is 100%. Therefore, by comparing the results obtained from the 3 samples (fresh sample, reacted sample at 500 °C, and reacted sample at 550 °C), it can be concluded that the minimum temperature for complete reduction of NiO to Ni by using glucose solution with S/C = 6 is 550 °C. Since no other phase except Al2O3 and solid Ni was observed. The use of CH4 as feed for the reduction of NiO was reported by Caravaggio et al. [29]. Complete reduction of NiO by CH4 can be achieved at a temperature of 725 °C [30]. FTIR in Figure 12, where the chemigram of Al2O3 and NiO samples is shown, is remarked in the following way. Both samples (Ni and Al2O3) released no CO below the temperature of 800 °C. There are fewer quantities of CO exhaust. But at temperatures above 430 °C, there are two strong signal peaks in the separation of NiO, which correspond to the two important mass losses. In the case of reducing NiO by charcoal and other intermediates of glucose pyrolysis, there is a huge release of CO2. Figure 13 displays the SEM image of the reduced catalyst, depicting a particulate and agglomerated structure observed at a temperature of 550 °C. The presence of NiO is evident in the form of dispersed particles across the Al2O3 support. Notably, these NiO particles exhibit a significant size variation, ranging from tens to hundreds of nanometers. Consequently, the larger NiO particles likely result from the aggregation of NiO crystallites. While the morphological characteristics of the catalyst may be intricate, it is discernible that a portion of the Al2O3 surface remains uncovered. To illustrate the morphology of carbon, it is evident that carbon is unevenly distributed, manifesting as a layer that partially covers the catalyst. The agglomerated form of carbon covers a substantial portion of the active sites in comparison to the particulate form, as exemplified by Dou et al. [31]. Furthermore, some NiO sites remain exposed. The empirical implication of this study is that biofuels such as ethanol, methanol, and glycerol can effectively serve as reducing agents for activating metal catalysts such as Ni in refinery processes. This means that, in practice, industries could potentially adopt these biofuels to replace conventional H2 gas in catalyst activation, leading to reduced operational costs, improved safety, and a lower environmental footprint. The study provides experimental evidence, through techniques including TGA, TGA-FTIR, and XRD, that biofuels can initiate reduction reactions at relatively low temperatures, making the process more energy-efficient. Hence, it opens up new pathways for sustainable catalyst regeneration and supports the integration of renewable resources into industrial systems.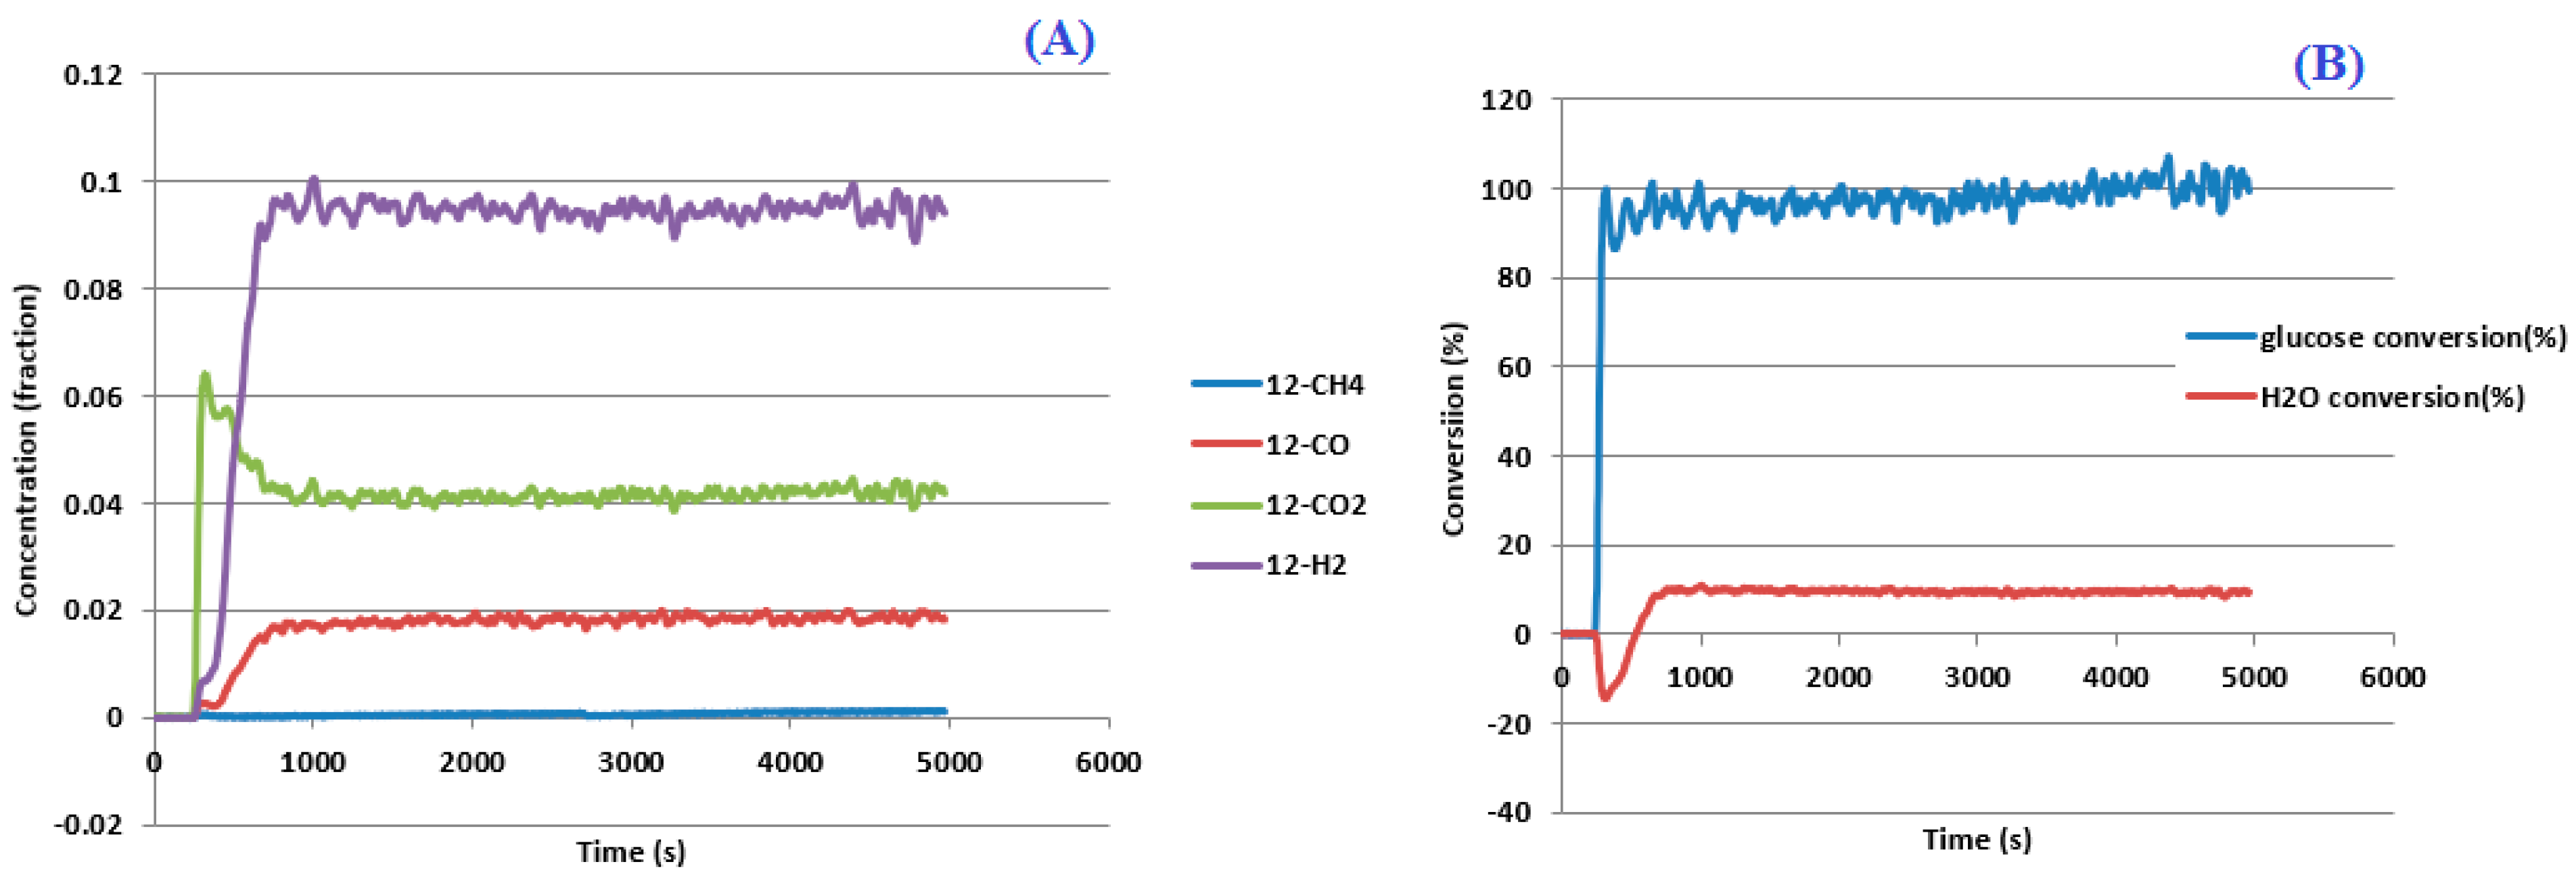
The reducing properties of glucose solution with S/C = 6 on NiO catalyst were characterized by XRD, TGA-FTIR, and SEM analysis. The steam reforming performance of the reduced catalyst was also conducted. The minimum temperature for feasible reduction is 550 °C. Besides, the reacted catalysts appeared in particle and agglomerated form below 650 °C. The TGA-FTIR result shows that the agglomerated sample contains much more carbon than the normal particles. SEM analysis revealed that the carbon in the agglomerated sample exists in the form of large flat plates (about 100 µm), while the deposition of carbon on the surface of the particle sample is in the form of short debris. However, at a temperature above 650 °C, there were no agglomerated phenomena. Agglomeration affects the steam reforming performance negatively. The disappearance of agglomeration catalysts will cause a large increase in the glucose conversion and H2 yield between 650 and 700 °C. The steam activity of the glucose solution reduced the catalyst was just below that of the H2 reduced catalyst, possibly attributed to denser carbon filament formation on the surface of the catalyst. However, at 700 °C, H2 purity is about 61%, H2 yield is 10.2% (i.e., 12.1% of the equilibrium value), while glucose and water conversions are 97 and 10%, respectively. However, the limitation of this study is that it focuses only on NiO and a few selected biofuels under controlled laboratory conditions. It does not explore long-term catalyst stability, reaction kinetics, or performance under industrial-scale settings, which are important for real-world applications.
| ABB | Asea Brown Boveri (Advanced Optima Analyzer Brand) |
| Al2O3 | Aluminium Oxide |
| CH4 | Methane |
| CO | Carbon Monoxide |
| CO2 | Carbon Dioxide |
| H2 | Hydrogen |
| H2O | Water |
| IR | Infrared |
| MKS | MKS Instruments Inc. (Mass Flow Controller) |
| Ni | Nickel |
| NiO | Nickel Oxide |
| N2 | Nitrogen |
| S/C | Steam-to-Carbon ratio |
| SCCM | Standard Cubic Centimeters per Minute |
| SEM | Scanning Electron Microscopy |
| TGA | Thermogravimetric Analysis |
| TGA-FTIR | Thermogravimetric Analysis–Fourier Transform Infrared Spectroscopy |
| XRD | X-Ray Diffraction |
Conceptualization, methodology, software: M.A.; Validation, formal analysis, funding acquisition: U.H.T. and A.M.A.; Investigation, resources, data curation, writing—original draft preparation, writing—review and editing, visualization, supervision: U.H.T., M.A.-H., A.M.A. and M.A.; project administration: M.A. and A.M.A. All authors have read and agreed to the published version of the manuscript.
The data used during the empirical study are presented using analytical graphs.
No consent for publication is required, as the manuscript does not involve any individual personal data, images, videos, or other materials that would necessitate consent.
The author(s) declare no conflicts of interest regarding this manuscript.
The study did not receive any external funding and was conducted using only institutional resources.
Not applicable.
[1] Fernandes, C.P. International Expansion Plan of PROGEST Angola. Mestrado em Gestão Aplicada, T&D-DM—Dissertações de Mestrado. 2022 Available online: https://repositorio.iscte-iul.pt/handle/10071/25256 (accessed on 13 December 2024).
[2] Maheshwari, P.; Haider, M.B.; Yusuf, M.; Klemeš, J.J.; Bokhari, A.; Beg, M.; Al-Othman, A.; Kumar, R.; Jaiswal, A.K. A Review on Latest Trends in Cleaner Biodiesel Production: Role of Feedstock, Production Methods, and Catalysts. J. Clean. Prod. 2022, 355, 131588. [CrossRef]
[3] Idris, M.N.; Zubairu, A.; Baba, D.; Adamu, M.N. Design and Development of 15,000 Barrel per Day (BPD) Capacity of Modular Crude Oil Refinery Plant. Int. J. Eng. Mod. Technol. 2018, 4, 1–13.Available online: https://pdfcoffee.com/qdownload.
[4] Guo, M.; Wu, C.; Chapman, S.; Yu, X.; Vinestock, T.; Hastings, A.; Smith, P.; Shah, N. Advances in Biorenewables-Resource-Waste Systems and Modelling. Carbon Capture Sci. Technol. 2023, 9, 100142. [CrossRef]
[5] Le, P.-A.; Trung, V.D.; Nguyen, P.L.; Phung, T.V.B.; Natsuki, J.; Natsuki, T. The Current Status of Hydrogen Energy: An Overview. RSC Adv. 2023, 13, 28262–28287. [CrossRef] [PubMed]
[6] Beluhan, S.; Mihajlovski, K.; ? antek, B.; ? antek, M.I. The Production of Bioethanol from Lignocellulosic Biomass: Pretreatment Methods, Fermentation, and Downstream Processing. Energies 2023, 16. [CrossRef]
[7] Gabdulkhakov, R.R.; Rudko, V.A.; Pyagay, I.N. Methods for Modifying Needle Coke Raw Materials by Introducing Additives of Various Origin (Review). Fuel 2022, 310, 122265. [CrossRef]
[8] Anekwe, I.M.S.; Isa, Y.M.; Oboirien, B. Bioethanol as a Potential Eco-Friendlier Feedstock for Catalytic Production of Fuels and Petrochemicals. J. Chem. Technol. Biotechnol. 2023, 98, 2077–2094. [CrossRef]
[9] Khalaf, Y.H.; Sherhan, B.Y.; Shakor, Z.M.; Al-Sheikh, F. Bimetallic Catalysts for Isomerization of Alkanes (A Review). Pet. Chem. 2023, 63, 829–843. [CrossRef]
[10] Straka, P.; Auersvald, M.; Vrtiška, D.; Kittel, H.; ? imáček, P.; Vozka, P. Production of Transportation Fuels via Hydrotreating of Scrap Tires Pyrolysis Oil. Chem. Eng. J. 2023, 460, 141764. [CrossRef]
[11] Alsudani, F.T.; Saeed, A.N.; Ali, N.S.; Majdi, H.S.; Salih, H.G.; Albayati, T.M.; Saady, N.M.C.; Shakor, Z.M. Fisher–Tropsch Synthesis for Conversion of Methane into Liquid Hydrocarbons through Gas-to-Liquids (GTL) Process: A Review. Methane 2023, 2, 24–43. [CrossRef]
[12] Masuda, T.; Ikesaka, N.; Muranaka, Y.; Tanabe, K. Proposal, Design, and Cost Analysis of a Hydrogen Production Process from Cellulose via Supercritical Water Gasification. RSC Adv. 2023, 13, 30306–30328. [CrossRef] [PubMed]
[13] Li, M.; Dong, J.; Deng, D.; Ouyang, X.; Yan, X.; Liu, S.; Luo, L. Mn3O4/NiO Nanoparticles Decorated on Carbon Nanofibers as an Enzyme-Free Electrochemical Sensor for Glucose Detection. Biosensors 2023, 13. [CrossRef]
[14] Martín, J.A.C. Hydrogen Production Through Steam Reforming of Model Bio-Oil Aqueous Fraction Using Metal-Supported Mesoporous Catalysts. Doctorate Program in Industrial Technologies: Chemistry, Environmental, Energy, Electronics, Mechanics and Materials from the Rey Juan Carlos University. 2020 Available online: https://dialnet.unirioja.es/servlet/tesis?codigo=301196 (accessed on 4 January 2025).
[15] Nabgan, W.; Alqaraghuli, H.; Nabgan, B.; Abdullah, T.T.; Ikram, M.; Medina, F.; Djellabi, R. Facile Synthesis of Precious Metal-Free Ti-Cu Nano-Catalyst for Enhanced Hydrogen and Liquid Fuels Production from In-Situ Pyrolysis-Catalytic Steam Reforming Reaction of Polystyrene Waste Dissolved in Phenol. Appl. Catal. B: Environ. 2022, 325, 122279. [CrossRef]
[16] Nair, R.R.; Mondal, M.M.; Srinivasan, S.V.; Weichgrebe, D. Biochar Synthesis from Mineral- and Ash-Rich Waste Biomass, Part 1: Investigation of Thermal Decomposition Mechanism during Slow Pyrolysis. Materials 2022, 15. [CrossRef]
[17] Ahsan, Z. Structural Correlation and Tunability of Magnetic and Electric Properties of Manganese Doped Cobalt Ferrite Nanoparticles. Postgraduate Dissertations (Theses) of Physics (PHY), Department of Physics, Bangladesh University of Engineering and Technology (BUET). 2020 Available online: http://lib.buet.ac.bd:8080/xmlui/handle/123456789/5748 (accessed on 4 January 2025).
[18] Szwacki, N.G.; Fabrykiewicz, P.; Sosnowska, I.; Fauth, F.; Suard, E.; Przeniosło, R. Orthorhombic Symmetry and Anisotropic Properties of Rutile TiO2. J. Phys. Chem. C 2023, 127, 19240–19249. [CrossRef]
[19] Cherpin, C.; Lister, D.; Dacquait, F.; Liu, L. Study of the Solid-State Synthesis of Nickel Ferrite (NiFe2O4) by X-Ray Diffraction (XRD), Scanning Electron Microscopy (SEM) and Raman Spectroscopy. Materials 2021, 14. [CrossRef]
[20] Narang, P.; Garcia, C.A.C.; Felser, C. The Topology of Electronic Band Structures. Nat. Mater. 2020, 20, 293–300. [CrossRef]
[21] Cheng, F.; Dupont, V.; Twigg, M.V. Temperature-Programmed Reduction of Nickel Steam Reforming Catalyst with Glucose. Appl. Catal. A Gen. 2016, 527, 1–8. [CrossRef]
[22] Li, L.; Huang, Z.; Shu, F.; Gao, Y.; Long, J. Hydrodeoxygenation of Heavy Lignin Bio-Oil to Oxygenated Fuel Catalyzed by CuxNiy/MgO. Fuel 2023, 357, 129805. [CrossRef]
[23] Chigova, J.T.; Mudono, S. Adsorption of Chromium (VI) Using Nano-ZnO Doped Scrap Tire-Derived Activated Carbon. J. Geosci. Environ. Prot. 2022, 10, 121–135. [CrossRef]
[24] Rezvani, M.A.; Ghasemi, K.; Ardeshiri, H.H.; Aghmasheh, M. Deep Oxidative Desulfurization of Gas Oil by Iron(III)-Substituted Polyoxometalate Immobilized on Nickel(II) Oxide, ((n-C4H9)4N)4H[PW11FeO39]@NiO, as an Efficient Nanocatalyst. Sci. Rep. 2023, 13. [CrossRef] [PubMed]
[25] Manfro, R.L.; Souza, M.M.V.M. Overview of Ni-Based Catalysts for Hydrogen Production from Biogas Reforming. Catalysts 2023, 13. [CrossRef]
[26] Vogt, E.T.C.; Fu, D.; Weckhuysen, B.M. Carbon Deposit Analysis in Catalyst Deactivation, Regeneration, and Rejuvenation. Angew. Chem. Int. Ed. Engl. 2023, 62, e202300319. [CrossRef] [PubMed]
[27] Rihm, S.D.; Kovalev, M.K.; Lapkin, A.A.; Ager, J.W.; Kraft, M. On the Role of C4 and C5 Products in Electrochemical CO2 Reduction via Copper-Based Catalysts. Energy Environ. Sci. 2023, 16, 1697–1710. [CrossRef]
[28] Prinz, N. Characterization of Nickel Catalysts for the Methanation Reaction Under Dynamic Gas Feed Conditions Using X-Ray Total Scattering. Doctoral Dissertation, Rheinisch-Westfälische Technische Hochschule Aachen, Veröffentlicht auf dem Publikationsserver der RWTH Aachen University, Aachen, Germany, 2024. .
[29] Caravaggio, G.; Nossova, L.; Turnbull, M.J. Nickel-Magnesium Mixed Oxide Catalyst for Low Temperature Methane Oxidation. Chem. Eng. J. 2021, 405, 126862. [CrossRef]
[30] Yaraghi, A.; Sapri, M.H.A.; Baharun, N.; Rezan, S.A.; Shoparwe, N.I.; Ramakrishnan, S.; Ariffin, K.S.; Fauzi, M.A.; Zabidi, H.B.; Ismail, H.; et al. Aeration Leaching of Iron from Nitrided Malaysian Ilmenite Reduced by Polystyrene-Coal Reductant. Procedia Chem. 2016, 19, 715–720. [CrossRef]
[31] Dou, S.; Hao, L.; Liu, H. Effects of Carbon Aggregates and Ionomer Distribution on the Performance of PEM Fuel Cell Catalyst Layer: A Pore-Scale Study. Renew. Energy 2023, 217, 119254. [CrossRef]